15 min read
 TRON (TRX) trades around $0.33 in early August 2026, roughly a quarter below its record high and holding a tighter range than almost any large-cap altcoin. TRX is the native token of the TRON blockchain — it pays network fees, is staked to earn Energy and Bandwidth, and above all settles the bulk of the world’s Tether (USDT) transfers. That last job is what makes TRX behave less like a speculative alt and more like the toll booth on a payments rail. This page lays out PrimeXBT’s price outlook for TRON through 2030 and out to 2050, the levels traders are watching now, and the catalysts that could move it. Figures here are PrimeXBT’s own estimates, rounded on purpose; the further out they run, the wider the uncertainty, and where the picture is genuinely unknowable we say so.
TRON outlook at a glance
- Current price: $0.33180 per TRX.
- 2026 base case: $0.310–$0.368, a year of quiet consolidation near current levels rather than a breakout.
- Main bullish catalyst: growing USDT settlement volume on TRON plus inflows into the newly launched US spot-and-staking TRX ETF.
- Biggest downside risk: a sustained break below the $0.3195 support if stablecoin activity migrates to rival chains or Fed policy stays tight.
- Long-term view: the base case grinds higher toward and past $1 by 2030, but every figure beyond then is a direction of travel, not a dated target.
Live TRON price chart
Today (21 October 2026) TRON (TRX/USD) is trading at $0.33180 per TRX, with a market cap of $31,496,878,352 USD. The 24-hour trading volume amounts to $385,103,521 USD. TRX price has changed by 0.15% in the last 24 hours. TRON’s circulating supply is 95,006,499,533 TRX.
Trading involves risk.
TRON price prediction 2026–2030 (yearly forecast)
The table below sets PrimeXBT’s expected range for each year, built from the monthly paths further down. Longer-horizon algorithmic targets, which rest on different assumptions and diverge by 2030, are kept in the analyst section rather than blended in here.
| Year | Minimum | Average | Maximum |
|---|---|---|---|
| 2026 | $0.310 | $0.336 | $0.368 |
| 2027 | $0.332 | $0.416 | $0.513 |
| 2028 | $0.436 | $0.543 | $0.679 |
| 2029 | $0.558 | $0.753 | $1.000 |
| 2030 | $0.780 | $1.038 | $1.334 |
TRON price prediction 2026
PrimeXBT’s 2026 outlook keeps TRX close to its early-August level of $0.33, a full-year range of $0.310–$0.368 averaging near $0.34. TRON’s realized volatility runs well below the altcoin average, so a narrow band fits the asset better than a dramatic swing would. The rest of the year reads as consolidation, not trend.
| Month (2026) | Minimum | Average | Maximum |
|---|---|---|---|
| August | $0.310 | $0.330 | $0.350 |
| September | $0.312 | $0.333 | $0.353 |
| October | $0.314 | $0.335 | $0.356 |
| November | $0.318 | $0.340 | $0.362 |
| December | $0.322 | $0.345 | $0.368 |
TRON price prediction 2027
2027 is where the first real step up shows: the path climbs off the low-$0.30s toward the low-$0.40s, a full-year range of $0.332–$0.513 averaging near $0.42. The lift rests on rising stablecoin settlement fees feeding back into TRX burns and staking demand, not on a single headline.
| Month (2027) | Minimum | Average | Maximum |
|---|---|---|---|
| January | $0.332 | $0.357 | $0.381 |
| February | $0.342 | $0.368 | $0.394 |
| March | $0.352 | $0.380 | $0.408 |
| April | $0.362 | $0.391 | $0.421 |
| May | $0.372 | $0.403 | $0.434 |
| June | $0.381 | $0.414 | $0.447 |
| July | $0.390 | $0.425 | $0.459 |
| August | $0.398 | $0.434 | $0.470 |
| September | $0.405 | $0.443 | $0.480 |
| October | $0.413 | $0.452 | $0.491 |
| November | $0.420 | $0.461 | $0.502 |
| December | $0.427 | $0.470 | $0.513 |
TRON price prediction 2028
By 2028 the outlook has TRX working toward the mid-$0.50s, a range of $0.436–$0.679 and an average near $0.54. This is the year the payments-rail thesis either compounds or stalls: more USDT throughput lifts the floor, while any migration of stablecoin volume to competing chains caps the ceiling.
| Month (2028) | Minimum | Average | Maximum |
|---|---|---|---|
| January | $0.436 | $0.481 | $0.525 |
| February | $0.445 | $0.492 | $0.538 |
| March | $0.454 | $0.502 | $0.551 |
| April | $0.463 | $0.513 | $0.564 |
| May | $0.471 | $0.524 | $0.576 |
| June | $0.480 | $0.535 | $0.589 |
| July | $0.489 | $0.546 | $0.603 |
| August | $0.500 | $0.559 | $0.618 |
| September | $0.510 | $0.572 | $0.634 |
| October | $0.520 | $0.585 | $0.649 |
| November | $0.530 | $0.597 | $0.664 |
| December | $0.541 | $0.610 | $0.679 |
TRON price prediction 2029
2029 pushes the average toward $0.75, with a full-year range of $0.558–$1.000. The band widens because the horizon does. A move into the $0.70s would put TRX firmly above its December 2024 record and into genuine price discovery, a level it has never held for a sustained stretch.
| Month (2029) | Minimum | Average | Maximum |
|---|---|---|---|
| January | $0.558 | $0.632 | $0.705 |
| February | $0.576 | $0.653 | $0.730 |
| March | $0.594 | $0.675 | $0.755 |
| April | $0.612 | $0.696 | $0.781 |
| May | $0.629 | $0.718 | $0.806 |
| June | $0.647 | $0.739 | $0.832 |
| July | $0.665 | $0.762 | $0.859 |
| August | $0.684 | $0.785 | $0.887 |
| September | $0.703 | $0.809 | $0.915 |
| October | $0.722 | $0.833 | $0.944 |
| November | $0.741 | $0.856 | $0.972 |
| December | $0.760 | $0.880 | $1.000 |
TRON price prediction 2030
PrimeXBT’s 2030 view centers on an average near $1.05, a range of $0.780–$1.334 that finally clears the round dollar. Reaching it assumes TRON keeps its lead in stablecoin settlement and that a broader risk-on backdrop holds; treat the month-by-month path below as a slope, not a set of appointments.
| Month (2030) | Minimum | Average | Maximum |
|---|---|---|---|
| January | $0.780 | $0.906 | $1.032 |
| February | $0.801 | $0.932 | $1.064 |
| March | $0.822 | $0.958 | $1.095 |
| April | $0.842 | $0.985 | $1.127 |
| May | $0.863 | $1.011 | $1.159 |
| June | $0.883 | $1.037 | $1.191 |
| July | $0.900 | $1.059 | $1.218 |
| August | $0.913 | $1.077 | $1.241 |
| September | $0.927 | $1.095 | $1.264 |
| October | $0.940 | $1.114 | $1.288 |
| November | $0.953 | $1.132 | $1.311 |
| December | $0.966 | $1.150 | $1.334 |
TRON long-term price prediction: 2035, 2040–2050
Put a number on TRON in 2050 and you are really forecasting the payments industry, US monetary policy, and stablecoin regulation a generation out, none of which anyone can see. So the figures below are a trajectory, not a promise, and the error bars only widen from here. With that stated plainly, PrimeXBT’s long-range path keeps climbing as stablecoin settlement scales, without ever bending into a hockey stick:
| Year | Minimum | Average | Maximum |
|---|---|---|---|
| 2035 | $1.189 | $1.450 | $1.711 |
| 2040 | $1.520 | $2.000 | $2.480 |
| 2050 | $2.176 | $3.200 | $4.224 |
The pattern across these years is steady compounding rather than a moonshot: an average near $1.45 by 2035, roughly $2.00 by 2040, and about $3.20 by 2050. Each rests on the assumption that TRON stays the default rail for dollar-denominated stablecoin transfers — the moment that stops being true, the whole curve resets lower.
What analysts and models say (compared)
TRON draws far fewer named bank targets than Bitcoin or Ethereum, so the public forecast field is dominated by algorithmic aggregators. They agree on direction and split on magnitude, most visibly at 2030, where the gap runs from roughly $1.03 to $1.43. Averaging models built on different assumptions would hide that split, so they sit side by side below.
| Source | Method | TRON view |
|---|---|---|
| CoinCodex | Algorithmic | 2026 avg ~$0.37 (range $0.33–$0.41); ~$1.42 by 2030 |
| Changelly | Algorithmic | 2026 avg ~$0.34 (range $0.32–$0.35); ~$1.03 by 2030 |
| Canary Capital (Staked TRX ETF) | Institutional access, not a price target | First US TRX ETF, live since May 2026 — a regulated demand channel rather than a forecast |
The 2030 spread is the real signal. CoinCodex projects TRX above $1.40, Changelly barely past $1.00, and neither publishes a bank-grade thesis behind the number. The institutional story here is access, not a target: Canary Capital’s staked TRX ETF gave US investors a regulated way to hold TRON with staking yield attached, which matters more for steady inflows than any single price call. Anyone looking for a Standard Chartered-style headline number on TRON will not find one yet.
Track record of this forecast
This is the first PrimeXBT price forecast published for TRON in this format. From the next monthly review onward, this section will line the previous forecast up against TRX’s actual price on the update date and explain any gap rather than paper over it. A forecast that never marks itself to market is not worth much, so the scorecard starts next update.
TRON technical analysis
TRX sits almost exactly on its own moving averages, the signature of a market with no strong trend. As of early August 2026 it trades near its 50-day exponential average of $0.328 and just above its 200-day average of $0.321 — the longer trend is flat-to-up, the shorter one has lost its earlier momentum. The RSI reads about 50, dead neutral, with neither an overbought nor an oversold extreme in play.
The support and resistance levels that matter now: support at $0.3236, then a firmer floor at $0.3195, with a deeper level near $0.3129; resistance at $0.3296, then $0.3338, with a broader ceiling around $0.3404. A clean break above $0.3404 would open room back toward the $0.44 record; losing $0.3195 on a closing basis would put the deeper support in play. The Fear & Greed Index sat at 25 — “extreme fear” — while TRX still held above its 200-day line, an unusual split that says the tape is calmer than the mood. For a primer on reading these signals, see PrimeXBT’s guide to crypto technical analysis.
Correlation with other assets
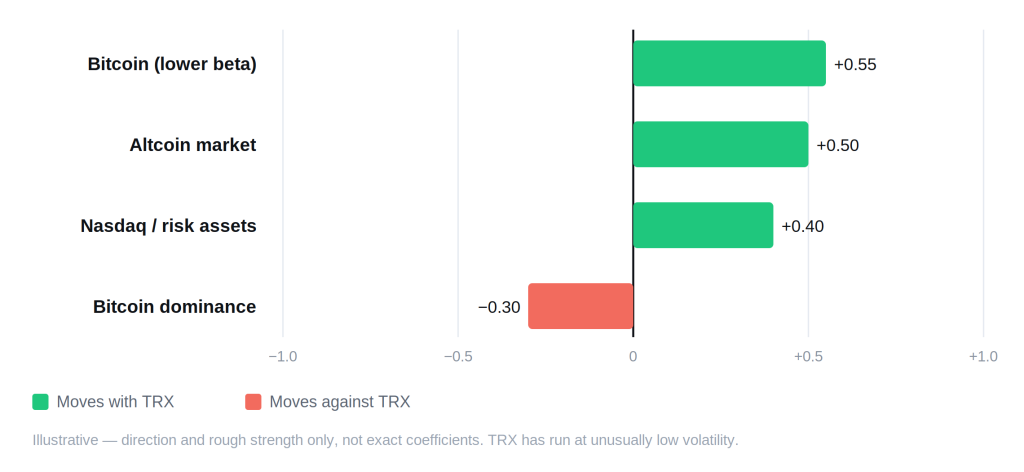
TRON does not trade like a typical high-beta alt. Its correlation to Bitcoin is positive but moderate, and TRX has at times decoupled from broad crypto selloffs — its record-low realized volatility, near 0.7% on a recent read, is a fraction of what most altcoins print. The reason is structural: much of TRON’s value tracks stablecoin settlement volume rather than pure speculation, so demand for block space rises with USDT payment activity even when prices are flat. That gives TRX a distinctive tie to on-chain transactional throughput that Bitcoin and most alts lack. It keeps a mild positive link to the wider altcoin market and to risk-on assets like the Nasdaq, and a mild inverse relationship with Bitcoin dominance. What sets TRON apart is that lower-beta, settlement-driven character: when speculators flee, a payments rail still meters transactions. None of these links are fixed numbers — they drift with the cycle, and low volatility is a description of the recent past, not a guarantee.
Fundamental factors
TRON is a layer-1 blockchain founded by Justin Sun in 2017, built for high-throughput, low-cost transfers. It runs on Delegated Proof-of-Stake: holders vote for 27 Super Representatives who produce blocks, and users freeze (stake) TRX to receive Energy and Bandwidth instead of paying cash fees on every transaction. That resource model is what keeps transfers cheap enough to run a payments business on.
The defining fundamental is stablecoin dominance. TRON settles close to half of all circulating USDT — roughly 47% of global Tether supply, with more than $85 billion in USDT living on the chain, at times more than sits on Ethereum. Every one of those transfers spends TRX, which ties the token’s demand to real payment flows rather than sentiment alone. The ecosystem also includes the JustLend lending market and the BitTorrent file-sharing network that TRON acquired in 2018.
On supply, TRON is now mildly inflationary after a long deflationary stretch. Transaction fees are burned, but an August 2025 fee cut roughly halved energy costs and reduced the TRX burned per transaction, so minting now slightly outpaces burning — net issuance runs near 790,000 TRX a day, an annualized rate around 0.3%. Circulating supply sits near 95 billion TRX and is inching up rather than shrinking. The market capitalization near $31 billion reflects that large float. The launch of a US spot-and-staking TRX TRON ETF in May 2026 added a regulated demand channel, though inflow data is too thin so far to forecast precisely.
Upcoming catalysts
Only confirmed, dated events are listed. With TRX now holding a mild link to risk assets, US monetary policy is the clearest near-term macro driver; TRON-specific upgrades without fixed mainnet dates are left off deliberately.
| Date | Event | Potential impact |
|---|---|---|
| September 15–16, 2026 | FOMC meeting (with economic projections) | Bull if the Fed signals cuts; bear if it holds rates higher for longer |
| October 27–28, 2026 | FOMC meeting | Rate path steers risk appetite across crypto, TRX included |
| December 8–9, 2026 | FOMC meeting (with economic projections) | Year-end policy signal for 2027 positioning |
FOMC dates follow the Federal Reserve’s published 2026 schedule. TRON’s own protocol changes are not listed because none carries a confirmed mainnet date at the time of writing, and an estimated date would be a guess, not information.
Bull case vs bear case
Bull case:
- USDT settlement volume on TRON keeps growing, spending more TRX and tightening the effective float.
- Inflows into the new staked TRX ETF build a steady, regulated source of demand.
- The Fed shifts to rate cuts and capital rotates back toward risk assets.
- Low volatility keeps TRX attractive as the cheapest large-chain rail for dollar stablecoins.
Bear case:
- Stablecoin issuers route more USDT to rival chains, eroding TRON’s core use case.
- Mild inflation keeps grinding the supply higher while burns stay muted.
- Rates stay higher for longer and risk appetite drains out of altcoins.
- Price loses the $0.3195 floor and the deeper $0.3129 support gives way on rising volume.
Invalidation levels. The bull case weakens if TRX closes below $0.3195, the firmer support; a break of $0.3129 below that would confirm the downside. The bear case is invalidated on a sustained close above $0.3404, and more decisively on a push toward the $0.44 record, which would mark the flat range as broken to the upside. Both triggers are the levels named in the technical section, read here as decision points rather than forecasts.
Historical performance
TRON’s chart is a story of one big cycle and a long, unusually calm grind. TRX launched in 2017, spiked toward $0.30 in the January 2018 mania, then shed more than 90% into the following bear market. Unlike most of that generation of alts, it clawed back methodically and set a record high of $0.4421 on December 3, 2024 — years later than the 2021 peaks most tokens never revisited. In early August 2026 it trades about 26% under that high, far closer to its record than the typical altcoin. The steadiness is the point: TRON has behaved more like an infrastructure holding than a lottery ticket, and no past cycle obliges the next one to rhyme.
Is TRON a good investment in 2026?
Whether TRON fits a portfolio comes down to what an investor wants from it. PrimeXBT’s outlook sees TRX roughly flat into year-end, a ~$0.34 average for 2026, with the real growth story sitting in later years as stablecoin settlement scales. The facts underneath are steadier than the price: TRON clears the most USDT of any chain, its token trades with unusually low volatility, and it now has a regulated ETF wrapper. Against that, supply has turned mildly inflationary and the entire thesis rests on keeping its stablecoin lead. Read as a bet on crypto payments infrastructure it looks different than it does as a bet on the next parabola — which of those a reader is making decides the answer.
How to trade TRON on PrimeXBT
On PrimeXBT you can take a position on TRON in either direction. CFDs on TRX can be traded long or short, so a view either way is expressible without holding the coin. Leverage magnifies gains and losses alike, which is why position sizing and a stop matter on every trade, and short selling lets you act on a downside view as readily as an upside one. Trade on your own analysis and risk tolerance, and never stake more than you can afford to lose.
Trading involves risk.
How we build this forecast
This outlook is assembled by PrimeXBT’s analysts, not copied from one price feed. We start from where TRX trades today, read its position against the 50- and 200-day moving averages and the support and resistance levels, weigh the fundamentals — stablecoin settlement share, staking demand, the burn-versus-mint balance, ETF flows — and set all of it against the macro backdrop, chiefly the path of US interest rates. The yearly ranges combine that technical read with the fundamental and macro picture; the long-range figures lean on trajectory rather than precision.
None of this is a guarantee. Crypto moves fast, the inputs change, and a single policy surprise or a shift in where stablecoins settle can move TRX quicker than any model expects. Treat every figure here as a considered estimate rather than a promise — we revisit and update the outlook monthly as the data changes.
How much will TRON be worth in 2026?
PrimeXBT's outlook is roughly $0.32–$0.35 for 2026, averaging near $0.34 — a year of consolidation close to current levels.
How much will TRON be worth in 2030?
The base case centers on an average near $1.05 in 2030, clearing the round dollar for the first time. A projection this far out carries real uncertainty, and the aggregator field itself splits between about $1.03 and $1.43.
Any TRON Crypto price prediction that suggests we are going to $10 should be looked at with skepticism, at least until we start to see more substantial adoption of the network.
What will be the price of TRX in 2025?
It is impossible to know, as shown by the wide range of estimates. Of the experts that we searched, there is roughly an $8 spread between the highest and lowest price.
At this point, any speculation on a TRON future price is going to be a struggle. While it does look overly bullish in general, any TRON price prediction for 2025 needs to be thought of as a potential target, not necessarily something you can count on.
What will TRON be worth in five years?
See 2030 above. On this horizon, read any single figure as a direction rather than a fixed target; the assumptions behind it, chiefly TRON's stablecoin lead, matter more than the number.
Will TRON reach $1?
On PrimeXBT's numbers, yes, but not until around 2030 in the base case — the path there runs through steadily rising USDT settlement volume, not a sudden spike.
Author



 Risk Disclaimer
The content provided here is for informational purposes only. It is not intended as personal investment advice and does not constitute a solicitation or invitation to engage in any financial transactions, investments, or related activities. Past performance is not a reliable indicator of future results.
The financial products offered by the Company are complex and come with a high risk of losing money rapidly due to leverage. These products may not be suitable for all investors. Before engaging, you should consider whether you understand how these leveraged products work and whether you can afford the high risk of losing your money.
The Company does not accept clients from the Restricted Jurisdictions as indicated in our website/ T&C. Some services or products may not be available in your jurisdiction.
The applicable legal entity and its respective products and services depend on the client’s country of residence and the entity with which the client has established a contractual relationship during registration.