10 min read
 Bitcoin’s daily RSI crosses 70. The textbook says sell. Price climbs for another six weeks, deep into the 80s, while the trader who sold watches from the sidelines and concludes the tool is broken. It isn’t. The rule he used is.
The RSI indicator is a momentum oscillator, developed by J. Welles Wilder in 1978, that measures the speed and size of recent price changes on a fixed 0-to-100 scale below the chart. It shows how strong recent momentum is, not where price will go next.
Almost every bad trade taken in the RSI’s name comes from confusing those two jobs.
What the RSI indicator actually measures
Wilder introduced the Relative Strength Index in his 1978 book New Concepts in Technical Trading Systems, and the name causes half the confusion on its own. It has nothing to do with one asset being strong relative to another. It measures a market’s strength relative to its own recent self.
Here’s the calculation without the algebra. Over a lookback window, 14 periods by default, the RSI averages the size of gains on up periods and the size of losses on down periods, forms their ratio, then rescales that ratio onto a 0-to-100 axis.
The rescaling is the whole point. A raw price can run anywhere, but the RSI is boxed between 0 and 100 no matter how violent the move. That lets you compare momentum extremes across different assets and timeframes on one axis. A reading near 100 means up periods have overwhelmed down periods lately. Near 0 means the reverse. The number is a snapshot of recent strength, and nothing in the math points at the future.
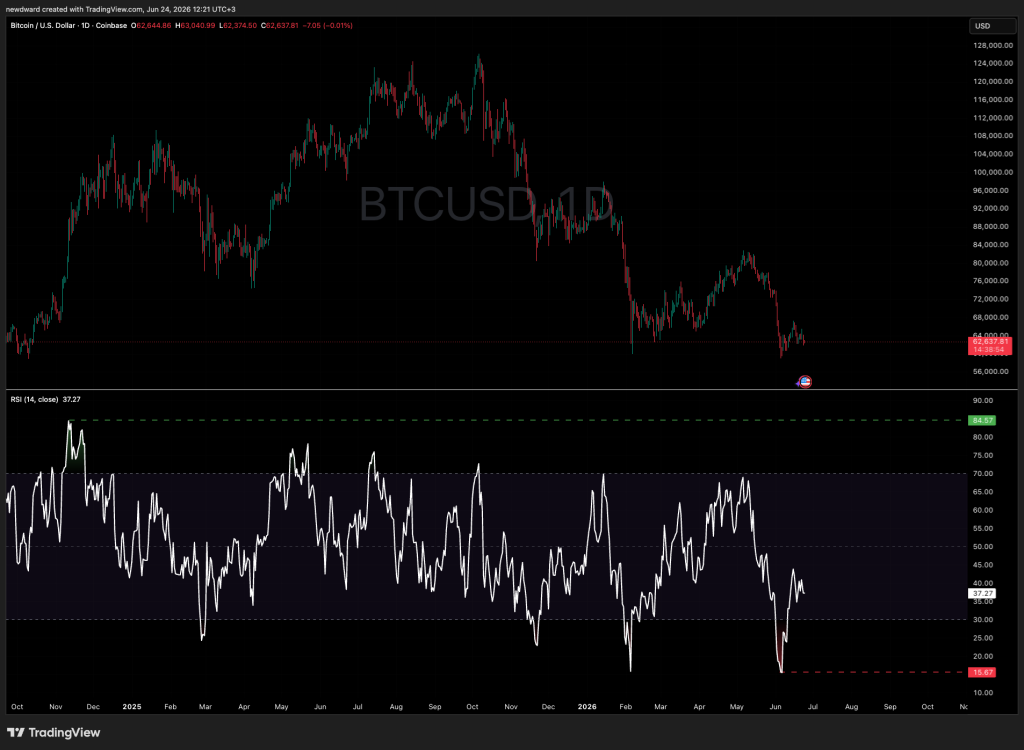
Most guides start at the two famous lines: 70 for overbought, 30 for oversold. Start one level in, at 50, and the rest makes more sense.
The 50 line splits net buying pressure from net selling pressure. When the RSI holds above 50, buyers are in control and the market is trending up. When it stays below 50, sellers have it and the trend is down. Read where the RSI sits relative to 50 before you read any 70 or 30 print. That single habit separates a momentum extreme inside a healthy trend from a genuine sign of exhaustion, which is the difference between a reading worth acting on and one worth ignoring.
Think of three zones rather than two lines: an overbought zone above 70, an oversold zone below 30, and the context line at 50 that tells you which of the two you should even be watching. In an uptrend you care about the oversold side; in a downtrend, the overbought side. The midline decides which.
Why “overbought” doesn’t mean sell
This is where the fixed-line rule falls apart. The analyst Andrew Cardwell documented that the RSI’s working range shifts with the trend it sits inside. In uptrends the indicator tends to travel roughly between 40 and 80. In downtrends, between 20 and 60.
So in a strong uptrend, the 40-to-50 area becomes support for the RSI, not the 30 line, and 70 stops being a ceiling. Sell every 70 print in that market and you’re selling strength, over and over, into a move that keeps running. The reading was right that momentum was high. It was wrong only as a reversal signal, because you asked a speedometer to tell you when the car would stop.
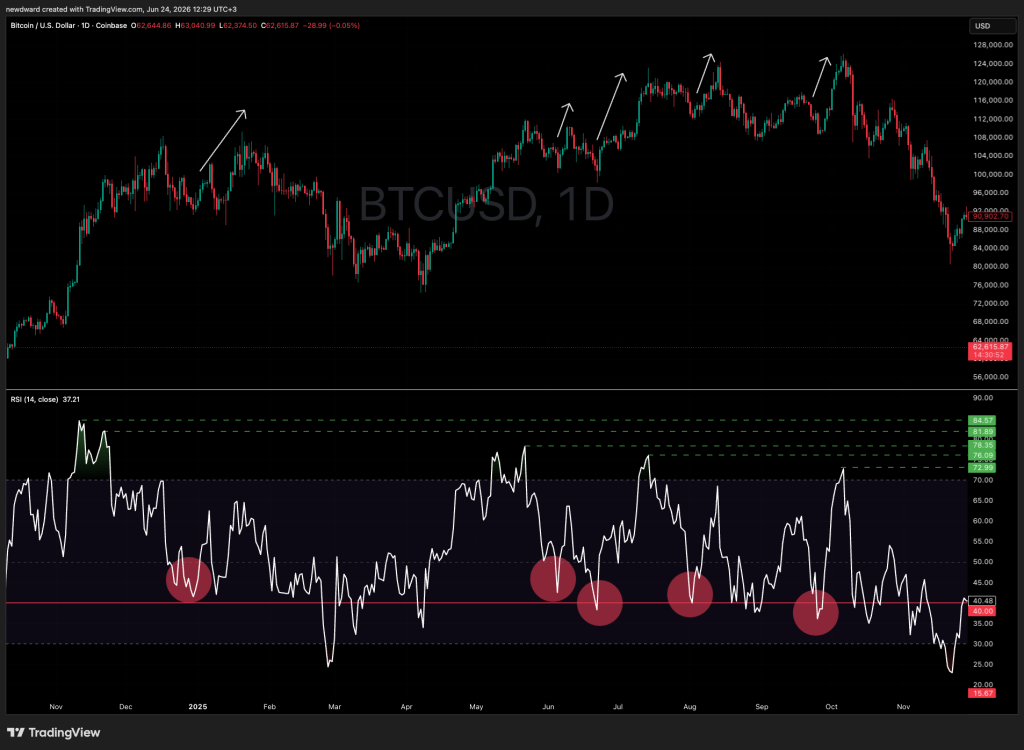
The fix is to read the RSI through the trend instead of against it. In an uptrend, the shifted 40-to-50 zone is where momentum resets, not the 30 that may never arrive. In a downtrend, bounces into 50 to 60 mark where selling tends to resume. The levels are relative to the regime, not carved into the chart.
RSI in crypto: momentum that overstays its welcome
Crypto stretches this to an extreme, because momentum in these markets runs unusually hot. Studying the most liquid coins, researchers Begušić and Kostanjčar found a pronounced momentum effect consistent with herding, traders piling into what’s already moving.
When momentum persists, so does the RSI. During a sustained Bitcoin bull run, the daily RSI can sit above 70 for weeks and push into the 80s while price climbs the entire time. That’s the six-week climb from the top of this article. A trader who treated the first 70 as a sell exited near the start of the move and spent the rest of it explaining why the indicator failed him. It didn’t fail. It reported high momentum accurately, and high momentum in crypto tends to feed on itself before it breaks.
RSI divergence: the signal that ignores the levels
Divergence is the reading that survives the whole fixed-line problem, because it doesn’t lean on any absolute number. It compares the direction of price with the direction of momentum, and it works whether the RSI is at 75 or 45.
A bearish divergence forms when price prints a higher high but the RSI prints a lower high. Price is still rising; each push is backed by less momentum. The trend is tiring even though the chart looks fine. A bullish divergence is the mirror image: price makes a lower low while the RSI makes a higher low, a hint that selling pressure is draining out of a decline before price turns.
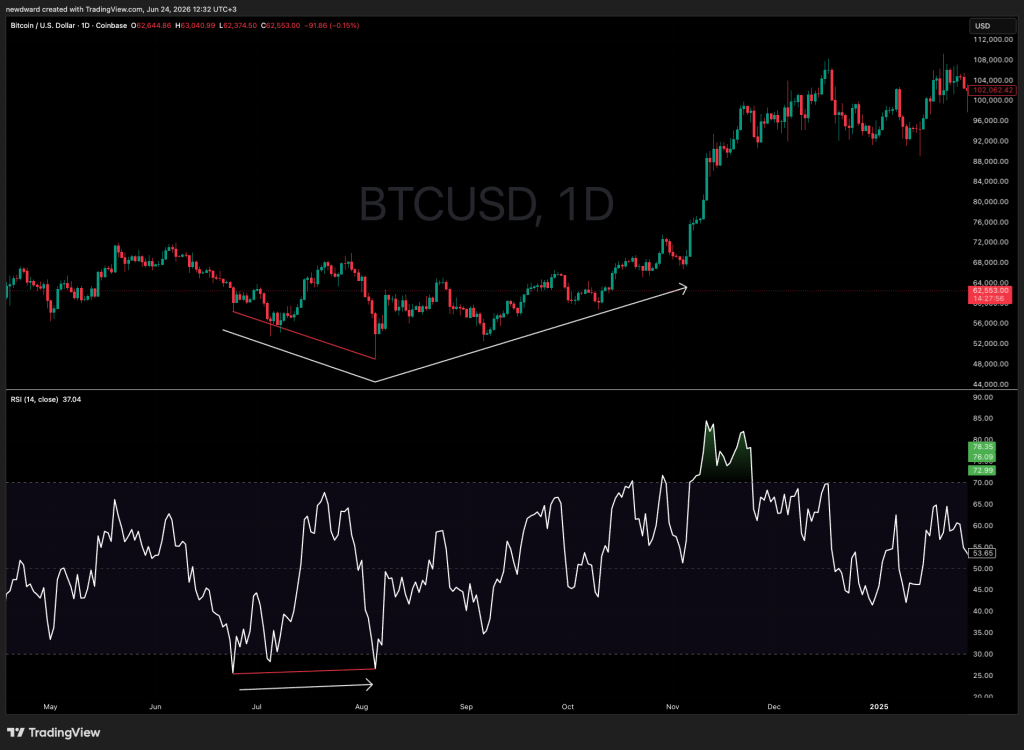
One caution keeps traders out of trouble here: divergence is a warning, not a trigger. Momentum can diverge from price for a long time in a strong trend before anything actually reverses. Treat it as a reason to tighten risk or wait for price itself to confirm, never as a standalone entry.
How traders actually use the RSI indicator
Put the levels together and the RSI earns its keep in three situations, none of which is “the number hit 70, so act.”
The first is extremes in a range. In a sideways market with no trend to shift the levels, a move above 70 that rolls over is a fair cue to expect a pullback, and a move below 30 that turns up cues a bounce. The signal isn’t the extreme. It’s the reaction at the extreme: price reaching it and then losing steam, ideally with a candle that confirms the turn. A reading of 72 is information, not an instruction.
The second is the midline as a trend filter, the 50-line read from earlier. The third is confirmation. The RSI flags where to look; price action decides whether to act. Used that way, it’s a filter that narrows your attention, not a bell that tells you to trade. It pairs naturally with trend tools like a moving average, which tells you the direction the RSI’s shifting range should follow.
Does the RSI actually work? What the research says
The honest answer is mixed, and it’s more useful than a clean yes. On the supportive side, Chong and Ng tested RSI rules on the London FT30 index across about six decades and found them beating buy-and-hold in most cases. Coakley, Marzano and Nankervis later ran a large set of rules across major currencies, with controls for data-snooping bias, and found that newer indicator rules including the RSI stayed profitable even as traditional moving-average rules lost their edge. Momentum, the thing the RSI tracks, is one of the most documented patterns in markets, so the tool rests on real ground.
On the skeptical side, those tests often flatter the indicator. Many didn’t subtract transaction costs; add realistic costs and data-snooping controls and much of the paper edge shrinks. Broader reviews keep finding that no single indicator beats buy-and-hold over the long run, and any edge that does exist tends to decay as more traders crowd into it.
What reconciles the two camps is regime. Overbought-oversold logic is a mean-reversion idea, and mean reversion works in ranging markets, where price oscillates around a center and stretched moves snap back. Drop the same logic into a strong trend and it fires a stream of losing counter-trend signals, which is the exact failure that makes people call the RSI broken. The tool isn’t broken. It’s being run against the conditions it was never built for. High volatility and strong trends punish it; quiet, range-bound markets reward it.
Read the RSI as a speedometer for momentum, not an alarm for reversals. Check the 50 line first. Let the working range ride up or down with the trend. Lean on divergence, not absolute levels, once a market is trending. And wait for price to confirm before you do anything. Inside the regime it fits, it earns its place. Used as a fixed buy-below-30, sell-above-70 switch in a crypto bull market, it does exactly what its critics complain about.
This explainer builds on the original chart-by-chart analysis published on TradingView by our analyst, worth reading for the annotated walkthrough on live Bitcoin charts.
What is a good RSI number?
There isn't a single good number, because the right levels move with the trend. In a range, above 70 is stretched and below 30 is stretched. In a strong uptrend, the RSI can hold in the 70s and 80s and pull back only to 40 to 50, so a reading of 75 there is normal rather than a warning. Read the 50 line first to know which levels apply.
Is the RSI a leading or lagging indicator?
The RSI is built from past prices, so it lags in the strict sense. In practice it behaves as an early-ish momentum read, especially through divergence, where momentum weakens before price turns. That makes it useful as a heads-up, but not as a standalone trigger.
What is the best RSI setting?
Wilder's default is 14 periods, and it remains the standard. A shorter setting reacts faster and gives more signals, most of them noise; a longer setting is smoother and slower. Change the number only if you know why the default doesn't suit your timeframe.
Does the RSI work for crypto?
It works, but crypto's strong momentum makes the fixed 70/30 rule especially dangerous. Overbought readings can persist for weeks during a bull run. In crypto more than anywhere, read the RSI through the trend and lean on divergence rather than absolute levels.
What's the difference between the RSI and the stochastic oscillator?
Both are bounded momentum oscillators, but they measure different things. The RSI gauges the size of recent gains versus losses; the stochastic oscillator measures where price closes within its recent high-low range. They often agree, and some traders use the stochastic for entry timing once the RSI has framed the trend.
Author


 Risk Disclaimer
The content provided here is for informational purposes only. It is not intended as personal investment advice and does not constitute a solicitation or invitation to engage in any financial transactions, investments, or related activities. Past performance is not a reliable indicator of future results.
The financial products offered by the Company are complex and come with a high risk of losing money rapidly due to leverage. These products may not be suitable for all investors. Before engaging, you should consider whether you understand how these leveraged products work and whether you can afford the high risk of losing your money.
The Company does not accept clients from the Restricted Jurisdictions as indicated in our website/ T&C. Some services or products may not be available in your jurisdiction.
The applicable legal entity and its respective products and services depend on the client’s country of residence and the entity with which the client has established a contractual relationship during registration.