15 min read
 The Sandbox (SAND) trades near $0.042 in August 2026, roughly 99.5% below the $8.40 it printed on November 24, 2021. The Sandbox is a voxel-style virtual world and game platform where creators build and monetize experiences on parcels of virtual LAND held as NFTs; SAND is its ERC-20 utility token, spent on LAND and in-world assets, staked, and used to vote in the platform’s DAO. This page sets out PrimeXBT’s price outlook for SAND through 2030 and out to 2050, the levels traders are watching now, and the events that could move the token. Each figure here is a considered estimate, not a promise, and where the evidence runs thin the page says so rather than dressing a guess as a number.
The Sandbox outlook at a glance
- Current price: $0.05797 per SAND.
- 2026 base case: $0.0386–$0.0492, a base-building year near current levels rather than a recovery.
- Main bullish catalyst: the broader crypto cycle turning risk-on into 2028, paired with a fresh brand-partnership or metaverse-AI narrative that pulls speculative flows back into virtual-world tokens.
- Biggest downside risk: Animoca’s strategic pivot away from the pure metaverse and still-thin user activity, confirmed by a sustained break below the $0.0404 support.
- Long-term view: a slow recovery is the base case, but any figure past 2030 is a direction of travel, not a target.
Live The Sandbox price chart
Today (21 October 2026) The Sandbox (SAND/USD) is trading at $0.05797 per SAND, with a market cap of $169,463,146 USD. The 24-hour trading volume amounts to $33,273,324 USD. SAND price has changed by -2.64% in the last 24 hours. The Sandbox’s circulating supply is 2,937,639,702 SAND.
Trading involves risk.
The Sandbox price prediction 2026–2030 (yearly forecast)
The table gives PrimeXBT’s expected range for each year, drawn from one continuous monthly path so the yearly figures and the month-by-month tables below agree by construction. Third-party targets for SAND scatter from below a cent to well above a dollar; rather than blend assumptions that cannot be reconciled, they are kept out of this table and shown separately in the analyst section.
| Year | Minimum | Average | Maximum |
|---|---|---|---|
| 2026 | $0.0386 | $0.0433 | $0.0492 |
| 2027 | $0.0421 | $0.0546 | $0.0700 |
| 2028 | $0.0559 | $0.0735 | $0.0894 |
| 2029 | $0.0510 | $0.0685 | $0.0864 |
| 2030 | $0.0456 | $0.0619 | $0.0768 |
The Sandbox price prediction 2026
PrimeXBT’s 2026 outlook holds SAND near its August level, an average near $0.044 across a full-year band of $0.0386–$0.0492. That is a token trying to build a floor, not turn a corner: the metaverse bid that carried 2021 has not come back, and the platform’s own upheaval this year gives the market little reason to re-rate SAND higher in the near term.
For the rest of 2026 the month-by-month path stays close to the current price, drifting rather than trending:
| Month (2026) | Minimum | Average | Maximum |
|---|---|---|---|
| August | $0.0386 | $0.0420 | $0.0454 |
| September | $0.0390 | $0.0425 | $0.0460 |
| October | $0.0393 | $0.0430 | $0.0467 |
| November | $0.0401 | $0.0440 | $0.0479 |
| December | $0.0408 | $0.0450 | $0.0492 |
The Sandbox price prediction 2027
2027 shows the first real upward tilt, an average near $0.055 over a range of $0.0421–$0.0700. The lift leans on the wider crypto cycle regaining a risk-on footing rather than on anything The Sandbox does alone — SAND has historically caught its bid late, once Bitcoin and the large caps have already moved.
| Month (2027) | Minimum | Average | Maximum |
|---|---|---|---|
| January | $0.0421 | $0.0465 | $0.0510 |
| February | $0.0433 | $0.0481 | $0.0528 |
| March | $0.0446 | $0.0496 | $0.0547 |
| April | $0.0458 | $0.0512 | $0.0565 |
| May | $0.0470 | $0.0527 | $0.0584 |
| June | $0.0482 | $0.0542 | $0.0602 |
| July | $0.0493 | $0.0556 | $0.0620 |
| August | $0.0503 | $0.0569 | $0.0636 |
| September | $0.0512 | $0.0582 | $0.0652 |
| October | $0.0521 | $0.0595 | $0.0668 |
| November | $0.0531 | $0.0607 | $0.0684 |
| December | $0.0540 | $0.0620 | $0.0700 |
The Sandbox price prediction 2028
2028 is the high point of the five-year view, an average near $0.075 across $0.0559–$0.0894. A Bitcoin halving falls the year before, and metaverse and gaming tokens have tended to catch a late-cycle bid when speculative appetite runs down the risk curve into small caps. The path assumes SAND rides that move, not that it leads it.
| Month (2028) | Minimum | Average | Maximum |
|---|---|---|---|
| January | $0.0559 | $0.0645 | $0.0730 |
| February | $0.0579 | $0.0669 | $0.0760 |
| March | $0.0598 | $0.0694 | $0.0790 |
| April | $0.0617 | $0.0718 | $0.0820 |
| May | $0.0636 | $0.0743 | $0.0851 |
| June | $0.0654 | $0.0768 | $0.0881 |
| July | $0.0660 | $0.0777 | $0.0894 |
| August | $0.0653 | $0.0772 | $0.0891 |
| September | $0.0646 | $0.0766 | $0.0887 |
| October | $0.0639 | $0.0761 | $0.0883 |
| November | $0.0632 | $0.0755 | $0.0879 |
| December | $0.0625 | $0.0750 | $0.0875 |
The Sandbox price prediction 2029
2029 gives part of the cycle gain back, an average near $0.068 within $0.0510–$0.0864. Nothing breaks; flows simply rotate elsewhere as the post-halving enthusiasm cools, and by this point the outlook rests on trend rather than any datable event, so read the monthly figures as a slope, not a schedule.
| Month (2029) | Minimum | Average | Maximum |
|---|---|---|---|
| January | $0.0614 | $0.0739 | $0.0864 |
| February | $0.0603 | $0.0728 | $0.0854 |
| March | $0.0592 | $0.0718 | $0.0844 |
| April | $0.0581 | $0.0707 | $0.0833 |
| May | $0.0570 | $0.0696 | $0.0823 |
| June | $0.0559 | $0.0685 | $0.0812 |
| July | $0.0549 | $0.0676 | $0.0803 |
| August | $0.0541 | $0.0669 | $0.0797 |
| September | $0.0534 | $0.0662 | $0.0790 |
| October | $0.0526 | $0.0655 | $0.0783 |
| November | $0.0518 | $0.0647 | $0.0777 |
| December | $0.0510 | $0.0640 | $0.0770 |
The Sandbox price prediction 2030
The 2030 view settles near a $0.062 average across $0.0456–$0.0768, still a small fraction of the 2021 record. Five years out the level matters more than the month-to-month wiggle, so treat the path below as a settling zone rather than a set of dated calls.
| Month (2030) | Minimum | Average | Maximum |
|---|---|---|---|
| January | $0.0506 | $0.0637 | $0.0768 |
| February | $0.0501 | $0.0634 | $0.0766 |
| March | $0.0497 | $0.0631 | $0.0765 |
| April | $0.0492 | $0.0628 | $0.0763 |
| May | $0.0488 | $0.0625 | $0.0761 |
| June | $0.0484 | $0.0622 | $0.0759 |
| July | $0.0479 | $0.0618 | $0.0757 |
| August | $0.0475 | $0.0615 | $0.0754 |
| September | $0.0470 | $0.0611 | $0.0752 |
| October | $0.0465 | $0.0607 | $0.0749 |
| November | $0.0461 | $0.0604 | $0.0747 |
| December | $0.0456 | $0.0600 | $0.0744 |
The Sandbox long-term price prediction: 2035, 2040–2050
Stretch the horizon to 2040 and you are betting on the state of consumer VR, the size of the next two or three crypto cycles, and whether people still log into virtual worlds at all. None of that is knowable today, so the figures below are a trajectory rather than a destination, and the error band widens with every year added. On that basis the long-range path drifts higher without ever approaching the old blow-off top:
| Year | Minimum | Average | Maximum |
|---|---|---|---|
| 2035 | $0.0648 | $0.0900 | $0.1152 |
| 2040 | $0.0792 | $0.1200 | $0.1608 |
| 2050 | $0.0986 | $0.1700 | $0.2414 |
What analysts and models say (compared)
Third-party forecasts for SAND are all over the map, which is the honest signal here. The bearish camp expects SAND to fade toward a cent; the middle sees a slow grind near current levels; one outlier prices in a full metaverse revival back above a dollar. Averaging outputs built on assumptions that far apart would hide the real picture, so they sit side by side.
| Source | Method | The Sandbox view |
|---|---|---|
| Changelly | Algorithmic | Bearish: 2026 avg ~$0.043, sliding toward ~$0.010 by 2030, ~$0.047 by 2040 |
| CoinPriceForecast | Statistical trend | ~$0.060 end-2026, ~$0.065 by 2030, ~$0.108 by 2035 |
| CoinDataFlow | Algorithmic | 2026 avg ~$0.031, wide bands, ~$0.157 avg by 2030 |
| DigitalCoinPrice | Algorithmic | Outlier: ~$0.98 in 2026, ~$1.85–$2.01 by 2030 |
The distance between the low and high 2030 calls is a factor of well over a hundred. Changelly reads SAND’s fading on-chain activity as reason to expect further erosion; DigitalCoinPrice extrapolates a metaverse comeback that no current usage data supports; CoinPriceForecast lands closest to a flat-to-slow-recovery base. PrimeXBT’s own path deliberately tracks that middle, constructive enough to price in a real cycle recovery without wagering on a second 2021. A reader hunting for one agreed number will leave empty-handed, and that spread is worth more than a false consensus.
Track record of this forecast
This is PrimeXBT’s first published SAND forecast, so there is no earlier call to mark yet. Every monthly update from here will set the previous forecast against SAND’s actual price on the review date and spell out what the model got wrong when it misses, rather than quietly moving the goalposts.
The Sandbox technical analysis
SAND trades below both of its most-watched moving averages, the standard signature of a downtrend that has not yet turned. It sits under a descending trendline and inside an intact weekly channel, neither of which has broken at the time of writing. The daily RSI reads about 32, with the weekly closer to 28 — the oversold end of the range, where sellers are stretched but no reversal is confirmed until a level actually gives way.
The support and resistance levels that matter now: immediate support at $0.0404, then $0.0355, with a deeper shelf near $0.0291; resistance at $0.0486, then $0.0574, with heavier supply around $0.0691. Reclaiming $0.0486 on real volume would be the first sign the near-term downtrend is cracking; clearing the moving averages above it would be the confirmation. Broad crypto sentiment sits in “Fear” on the market’s Fear & Greed gauge, which fits a token grinding sideways near multi-year lows. For the tools behind these readings, see PrimeXBT’s guide to crypto technical analysis.
Correlation with other assets
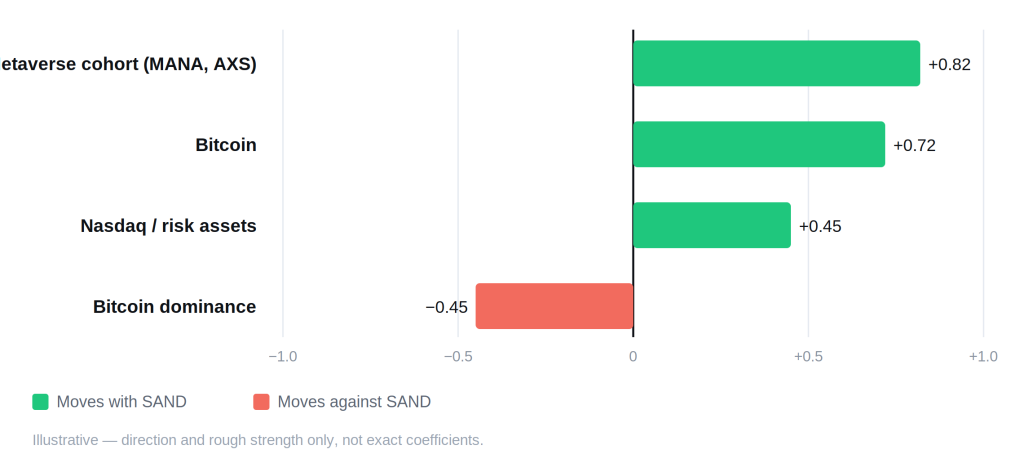
SAND trades as a high-beta expression of the metaverse theme more than as a market with its own gravity. Its closest companion is Decentraland’s MANA — the two virtual-world LAND tokens tend to rise and fade in step — with Axie Infinity’s AXS and the wider gaming cohort usually along for the ride. Against Bitcoin the link is positive but amplified: SAND lags in the melt-ups and drops harder in the flushes. What gives SAND its own pulse is the headline: a marquee brand tie-up, a big-tech VR reveal, or an “AI avatars” story can spark a sharp, news-driven pop, and the size of those spikes ultimately tracks how much LAND demand and in-world activity the platform can actually show. When Bitcoin dominance climbs and capital crowds into Bitcoin, thin small caps like SAND are first to bleed. It also moves with the Nasdaq as a risk-on asset, so shifts in Fed rate expectations reach it quickly. There is no safe-haven angle to reach for here: gold and the dollar index barely register, and SAND’s floor rests on whether the world it powers keeps drawing people in.
Fundamental factors
The Sandbox is a user-generated-content metaverse: creators use free voxel tools to build games, galleries, and social spaces, publish them on parcels of virtual LAND minted as NFTs, and monetize what they make. SAND is the currency that runs the economy — it buys LAND and assets, can be committed to staking for rewards, and carries governance votes in the Sandbox DAO. The project grew out of Pixowl’s 2012 mobile game, was acquired by Animoca Brands in 2018, and was rebuilt into a blockchain metaverse by Sébastien Borget and Arthur Madrid, whose recurring Alpha Season events opened the world to players in timed waves.
Its calling card has always been the brand roster. Adidas, Gucci, Snoop Dogg, Warner Music, Ubisoft, and more recently Cirque du Soleil and Playboy have all built or backed experiences inside The Sandbox, and those deals are what historically moved the token. That roster drove the late-2021 mania that carried SAND to $8.40 when Facebook’s rebrand to Meta set off a metaverse land grab. Engagement thinned hard once the hype drained, and the gap between a marquee partnership and the daily foot traffic to justify it became the fundamental the price keeps answering to.
2025 reset the story. Animoca Brands, the platform’s largest backer with roughly $300 million invested over eight years, took full operational control: Borget moved to an ambassador role and Madrid to chairman, both stripped of executive power, more than half of the roughly 250 staff were laid off, and the roadmap tilted toward crypto-native products, including a memecoin launchpad, alongside the virtual world. On tokenomics, SAND is close to fully diluted — around 2.94 billion of a fixed 3 billion maximum already circulate — so unlike many alts it carries little forward unlock overhang, and future supply pressure is limited. For where SAND sits among its peers, see PrimeXBT’s roundup of metaverse crypto.
Upcoming catalysts
Only confirmed, dated events are listed. Because SAND trades as a risk-on small cap, U.S. monetary policy is the clearest scheduled driver; the Sandbox-specific events that move it most, Alpha Season launches and brand reveals, rarely carry firm public dates far enough ahead to treat as catalysts.
| Date | Event | Potential impact |
|---|---|---|
| September 15–16, 2026 | FOMC meeting (with economic projections) | Bull if the Fed signals cuts; bear if it holds rates higher for longer |
| October 27–28, 2026 | FOMC meeting | Rate path steers risk appetite, which reaches small caps like SAND last |
| December 8–9, 2026 | FOMC meeting (with economic projections) | Year-end policy signal that frames 2027 positioning |
FOMC dates follow the Federal Reserve’s published 2026 schedule. No Sandbox release is listed with a date because none is confirmed publicly at the time of writing, and inventing one would be noise, not information.
Bull case vs bear case
Bull case:
- A risk-on crypto cycle into 2028 lifts high-beta altcoins, and the metaverse and gaming theme rotates back into favor.
- A marquee brand launch or an AI-avatar narrative revives speculative interest in virtual-world tokens.
- Near-full dilution means no large scheduled unlocks hang over the price, so demand meets a fixed float.
- Animoca’s balance sheet keeps development funded through the downturn, and staking locks up part of the supply.
Bear case:
- The pivot toward crypto-native products dilutes the original metaverse thesis that drew SAND holders in.
- Daily activity and LAND demand stay soft, and the “empty metaverse” story hardens.
- Bitcoin dominance stays elevated, starving thin altcoins of liquidity.
- SAND keeps failing at $0.0486 and the oversold reading simply persists rather than snapping back.
Invalidation levels. The bull case loses its footing if SAND closes decisively below $0.0404, since that reopens $0.0355 and the deeper $0.0291 shelf and confirms sellers still hold the range. The bear case is invalidated on a sustained reclaim of $0.0486, and more convincingly on a break above $0.0574 that carries price back over the moving averages — the line that would mark the multi-year downtrend as genuinely broken. Neither trigger is invented for this section; both are the same $0.0404 and $0.0486 levels the chart is already trading around.
Historical performance
SAND’s chart is one vertical spike bracketed by long, quiet declines. It ran from cents in early 2021 to $8.40 that November as the Meta rebrand lit a metaverse land rush, then surrendered almost all of it over the years that followed. In August 2026 it trades roughly 99.5% below that peak, below its own long-term averages, and near multi-year lows. The record says SAND’s big moves come from narrative and brand headlines, not from steady adoption, and those arrive on nobody’s schedule.
Is The Sandbox a good investment in 2026?
What a buyer is really wagering on is whether The Sandbox stays a metaverse bet at all. PrimeXBT’s outlook sees SAND roughly flat into year-end, an average near $0.044, with the token building a base rather than recovering. The facts underneath are plain: SAND trades far below its long-term averages, market sentiment sits in “Fear,” daily engagement is thin, and Animoca’s 2025 overhaul has pointed the roadmap partly away from the virtual world that gave the token its story. For a patient buyer, a near-fully-diluted token with a deep-pocketed backer and a recognizable brand roster is one kind of setup; for anyone expecting a quick round trip to old highs, the usage data offers little to lean on. PrimeXBT’s comparison of Decentraland and The Sandbox lays out how the two leading metaverse tokens stack up.
How to trade The Sandbox on PrimeXBT
On PrimeXBT you can take a position on The Sandbox in either direction. CFDs on SAND can be traded long if you expect a recovery or short if you expect further weakness, without holding the token itself. Leverage magnifies gains and losses alike, and on a thin, headline-driven token that cuts both ways fast, so position sizing and a stop-loss carry real weight on every trade. Trade on your own analysis and risk tolerance, and never commit more than you can afford to lose.
Trading involves risk.
How we build this forecast
PrimeXBT’s analysts assemble this outlook rather than lift it from a single price feed. The starting point is where SAND trades today, read against its 50- and 200-day moving averages and the support and resistance levels framing the chart. On top of that sits the fundamental picture — LAND demand and user activity, staking, the fixed near-fully-diluted supply, and Animoca’s reshaped roadmap — set against the macro backdrop, chiefly the path of U.S. interest rates and how much appetite the market has for small-cap risk. The yearly ranges come from one continuous month-by-month model, which is why the annual and monthly tables agree; the long-range figures lean on trajectory rather than precision.
None of this is a guarantee. SAND is a small-cap, narrative-driven token that can move faster than any model on a single brand or macro headline, and the inputs shift constantly. Treat every figure here as a considered estimate, and note that the outlook is revisited and updated each month as the data moves.
How much will The Sandbox be worth in 2026?
PrimeXBT's outlook puts SAND at an average near $0.044 for 2026, with the full year covered by the range in the 2026 table above. That reflects a token building a base close to current levels, not staging a recovery.
How much will The Sandbox be worth in 2030?
Our base case centers near $0.062 for 2030, still a small fraction of the 2021 record. Any five-year crypto forecast should be read as a broad direction, because the plausible range is wide and widens further the longer the horizon.
What will The Sandbox be worth in five years?
See the 2030 figure above. On this horizon the single number matters less than the shape, which our model reads as a slow grind higher rather than a return to old highs.
Will The Sandbox reach $1?
Not on our numbers. SAND last traded near $1 in 2022, and getting back would mean roughly a twenty-fold rise from today. Our modeled path does not approach $1 even at the 2050 horizon; it would take a full metaverse revival on the scale of 2021 to put $1 back in reach.
Why is SAND so far below its all-time high?
SAND reached $8.40 in November 2021 during the metaverse mania that followed Facebook's rebrand to Meta. When that hype faded and The Sandbox's daily engagement fell, the speculative premium drained away, leaving the token near $0.042 in 2026.
Author



 Risk Disclaimer
The content provided here is for informational purposes only. It is not intended as personal investment advice and does not constitute a solicitation or invitation to engage in any financial transactions, investments, or related activities. Past performance is not a reliable indicator of future results.
The financial products offered by the Company are complex and come with a high risk of losing money rapidly due to leverage. These products may not be suitable for all investors. Before engaging, you should consider whether you understand how these leveraged products work and whether you can afford the high risk of losing your money.
The Company does not accept clients from the Restricted Jurisdictions as indicated in our website/ T&C. Some services or products may not be available in your jurisdiction.
The applicable legal entity and its respective products and services depend on the client’s country of residence and the entity with which the client has established a contractual relationship during registration.