14 min read
 Polygon (POL) trades around $0.075 in early August 2026, roughly 97% below the $2.92 record it set in December 2021 — back when the token still traded as MATIC. POL is the native asset of Polygon, an Ethereum scaling network: it pays gas on the Polygon PoS chain, secures the network through staking, and carries governance rights across Polygon’s expanding set of chains. One naming point first, because it trips up every search: MATIC and POL are the same asset. Polygon migrated MATIC to POL at a 1:1 ratio, the swap went live in September 2024, and by mid-2026 about 99% of supply had converted — POL is now the token that fuels and secures the network. This page lays out PrimeXBT’s price outlook for POL through 2030 and out to 2050, the levels traders are watching, and the catalysts that could move it.
Polygon outlook at a glance
- Current price: $0.09593 per POL.
- 2026 base case: $0.069–$0.096, averaging near $0.082 — an attempt to base out after a long decline, not a fresh bull market.
- Main bullish catalyst: real usage flowing to POL as Polygon 2.0 and the AggLayer knit its chains together and payments, stablecoins, and tokenized assets settle on the network.
- Biggest downside risk: intensifying layer-2 competition and a sustained break below the $0.069 support, especially into a broad risk-off tape.
- Long-term view: a gradual recovery is the base case, but any figure past 2030 is a direction of travel, not a target.
Live Polygon price chart
Today (21 October 2026) Polygon (POL/USD) is trading at $0.09593 per POL, with a market cap of $1,010,665,659 USD. The 24-hour trading volume amounts to $83,909,342 USD. POL price has changed by 0.72% in the last 24 hours. Polygon’s circulating supply is 10,635,632,828 POL.
Trading involves risk.
Polygon price prediction 2026–2030 (yearly forecast)
The table below sets PrimeXBT’s expected range for POL each year. The wildly divergent third-party targets — some models see POL halving again, others see it multiplying several times over — are kept out of this table and laid side by side in the analyst section, because averaging forecasts built on opposite assumptions would only mislead.
| Year | Minimum | Average | Maximum |
|---|---|---|---|
| 2026 | $0.069 | $0.082 | $0.096 |
| 2027 | $0.084 | $0.118 | $0.157 |
| 2028 | $0.128 | $0.179 | $0.243 |
| 2029 | $0.183 | $0.238 | $0.297 |
| 2030 | $0.152 | $0.211 | $0.270 |
Polygon price prediction 2026
PrimeXBT’s 2026 outlook keeps POL close to its early-August level near $0.075, in a range of $0.069–$0.096 that averages near $0.082. That is a token trying to find a floor rather than one breaking out — the recovery, if it comes, starts small. The forward-month path below runs from August to December; the months already behind us are price history, not forecast.
| Month (2026) | Minimum | Average | Maximum |
|---|---|---|---|
| August | $0.069 | $0.075 | $0.081 |
| September | $0.072 | $0.079 | $0.085 |
| October | $0.075 | $0.082 | $0.089 |
| November | $0.078 | $0.085 | $0.092 |
| December | $0.080 | $0.088 | $0.096 |
Polygon price prediction 2027
2027 is the first real step up in PrimeXBT’s outlook: POL climbs off its base toward a full-year range of $0.084–$0.157, averaging near $0.12. The move leans on the Ethereum scaling narrative regaining favour and on Polygon converting network activity into demand for POL, not on one dramatic catalyst.
| Month (2027) | Minimum | Average | Maximum |
|---|---|---|---|
| January | $0.084 | $0.093 | $0.102 |
| February | $0.088 | $0.098 | $0.107 |
| March | $0.093 | $0.103 | $0.113 |
| April | $0.097 | $0.108 | $0.119 |
| May | $0.101 | $0.113 | $0.124 |
| June | $0.105 | $0.118 | $0.130 |
| July | $0.108 | $0.122 | $0.135 |
| August | $0.111 | $0.125 | $0.140 |
| September | $0.114 | $0.129 | $0.144 |
| October | $0.117 | $0.133 | $0.148 |
| November | $0.120 | $0.136 | $0.153 |
| December | $0.123 | $0.140 | $0.157 |
Polygon price prediction 2028
2028 carries the recovery further, with POL working through a range of $0.128–$0.243 and an average near $0.18. This is the year the broader crypto cycle typically reheats after a Bitcoin halving, and high-beta layer-2 tokens like POL tend to move late and hard when liquidity returns to altcoins.
| Month (2028) | Minimum | Average | Maximum |
|---|---|---|---|
| January | $0.128 | $0.146 | $0.165 |
| February | $0.133 | $0.152 | $0.172 |
| March | $0.138 | $0.158 | $0.179 |
| April | $0.143 | $0.165 | $0.187 |
| May | $0.147 | $0.171 | $0.194 |
| June | $0.152 | $0.177 | $0.202 |
| July | $0.157 | $0.183 | $0.209 |
| August | $0.161 | $0.188 | $0.215 |
| September | $0.165 | $0.194 | $0.222 |
| October | $0.169 | $0.199 | $0.229 |
| November | $0.173 | $0.205 | $0.236 |
| December | $0.177 | $0.210 | $0.243 |
Polygon price prediction 2029
2029 marks the peak year in PrimeXBT’s five-year view: POL trades through a range of $0.183–$0.297, averaging near $0.24 before momentum cools. Placing the cyclical top here reflects how alt liquidity has historically crested roughly 18 months after a halving, then thinned.
| Month (2029) | Minimum | Average | Maximum |
|---|---|---|---|
| January | $0.183 | $0.217 | $0.251 |
| February | $0.188 | $0.224 | $0.260 |
| March | $0.193 | $0.231 | $0.268 |
| April | $0.198 | $0.238 | $0.277 |
| May | $0.203 | $0.245 | $0.286 |
| June | $0.208 | $0.252 | $0.295 |
| July | $0.209 | $0.253 | $0.297 |
| August | $0.204 | $0.248 | $0.292 |
| September | $0.200 | $0.244 | $0.287 |
| October | $0.196 | $0.239 | $0.283 |
| November | $0.191 | $0.235 | $0.278 |
| December | $0.187 | $0.230 | $0.273 |
Polygon price prediction 2030
2030 is the cool-down after the peak: PrimeXBT’s range spans $0.152–$0.270, averaging near $0.21. Five years out the numbers describe a shape, not a schedule, so read the month-by-month path as a trajectory that eases lower rather than a set of dated prices.
| Month (2030) | Minimum | Average | Maximum |
|---|---|---|---|
| January | $0.184 | $0.227 | $0.270 |
| February | $0.181 | $0.224 | $0.267 |
| March | $0.178 | $0.221 | $0.264 |
| April | $0.174 | $0.218 | $0.261 |
| May | $0.171 | $0.215 | $0.258 |
| June | $0.168 | $0.212 | $0.255 |
| July | $0.166 | $0.209 | $0.252 |
| August | $0.163 | $0.206 | $0.249 |
| September | $0.160 | $0.203 | $0.246 |
| October | $0.157 | $0.200 | $0.243 |
| November | $0.155 | $0.198 | $0.241 |
| December | $0.152 | $0.195 | $0.238 |
Polygon long-term price prediction: 2035, 2040–2050
Push the horizon past a decade and precision stops being honest. No model can price ten years of halvings, rival scaling tech, and macro regimes that have not been invented yet, so the figures below are a slope, not a promise, and the error bars fan out with every year. On that basis PrimeXBT’s long-range path grinds higher without ever going vertical: an average near $0.34 in 2035, near $0.50 in 2040, and near $0.78 in 2050 — still short of the round-number targets POL last touched under the MATIC ticker.
| Year | Minimum | Average | Maximum |
|---|---|---|---|
| 2035 | $0.252 | $0.340 | $0.428 |
| 2040 | $0.340 | $0.500 | $0.660 |
| 2050 | $0.468 | $0.780 | $1.092 |
What analysts and models say (compared)
Few tokens split forecasters as sharply as POL. Algorithmic models that read momentum and volatility mostly project further decline, since POL has trended down for two years; forecasters that weight Polygon’s roadmap and payments push see a multi-fold recovery. The gap is the honest picture, so the views sit side by side rather than blended.
| Source | Method | Polygon (POL) view (2030 unless noted) |
|---|---|---|
| CoinCodex | Algorithmic | Bearish — avg ~$0.036 (range ~$0.025–$0.051) |
| Changelly | Algorithmic | Bearish — avg ~$0.035, extending lower over the decade |
| Cryptopolitan | Editorial / model | Bullish — avg ~$0.64 (range ~$0.57–$0.72) |
The spread runs from roughly $0.035 to $0.64 for the same year — an order of magnitude apart. Momentum-driven models extrapolate the existing downtrend and land near $0.03–$0.05; narrative-driven forecasts assume Polygon 2.0 and the AggLayer convert usage into token demand and reach for $0.60 and beyond. Anyone hunting a single “consensus” number for POL will not find one, and a mid-point between incompatible methods would be a fiction.
Track record of this forecast
This is the first published PrimeXBT price forecast for Polygon under the POL ticker. From the next monthly review onward, this section will hold the prior forecast against POL’s actual price on the update date and explain any miss plainly, rather than quietly revising the record.
Polygon technical analysis
POL sits pinned between its key moving averages, closer to weak than strong. It trades around its 50-day simple moving average near $0.078 and below its 200-day average near $0.092, so the medium-term trend is flat-to-soft and the longer trend still points down. The RSI has held near the neutral 50 line through late July, neither overbought nor oversold — a market without conviction in either direction.
The support and resistance levels that matter now: immediate support near $0.074, then $0.069, with a deeper floor around $0.064; resistance near $0.085, then the 200-day zone around $0.090–$0.092, and $0.095 above that. Reclaiming the 200-day average would be the first real signal that the two-year downtrend has broken. The Fear & Greed Index has drifted through fear-to-neutral territory in recent weeks, readings roughly in the high-20s to mid-40s depending on the source. For a primer on reading these signals, see PrimeXBT’s guide to crypto technical analysis.
Correlation with other assets
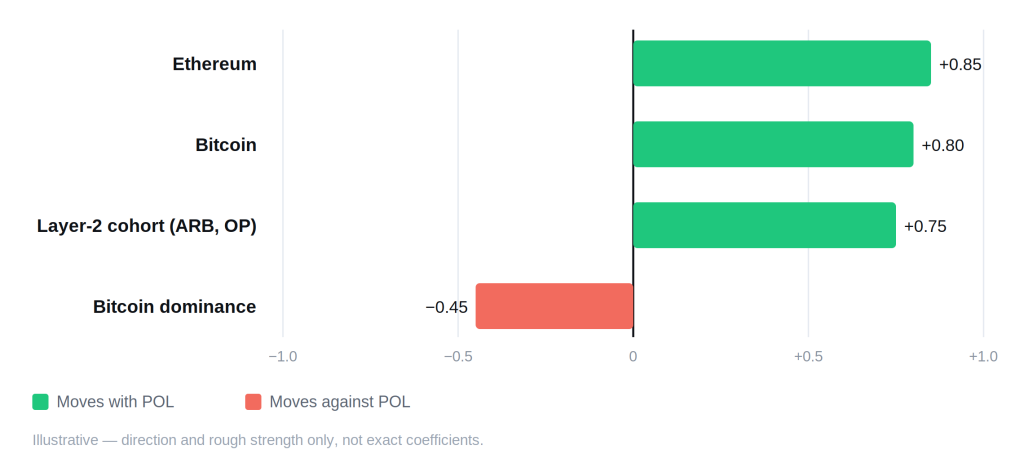
POL is tied to Ethereum more tightly than almost any large alt, and for a structural reason: Polygon exists to scale Ethereum, so its fortunes rise and fall with Ethereum’s own momentum and with how much the market cares about the layer-2 scaling story on any given month. Layer above that, POL behaves as a high-beta play on Bitcoin — it tends to fall harder than BTC on down days and rally harder when risk appetite returns. It also trades as part of a pack: Arbitrum, Optimism, and the other scaling tokens move together, so a good week for the L2 cohort is usually a good week for POL. When capital rotates toward Bitcoin and Bitcoin dominance climbs, POL and its peers typically lag. And since institutions started treating crypto as a risk asset, POL has taken more of its cue from the Nasdaq and the Fed’s rate path than it once did. Treat these as directions that shift with the cycle, not fixed coefficients.
Fundamental factors
Polygon’s whole reason to exist is making Ethereum cheaper and faster to use. That started with the Polygon PoS chain and expanded into zero-knowledge scaling through Polygon zkEVM, and it now sits under a wider plan the team calls Polygon 2.0 — a design meant to turn many separate chains into one network that feels like a single system to users. The connective piece is the layer-2 AggLayer, a settlement layer that lets value and messages move across those chains without the usual bridge friction, and the Chain Development Kit (CDK), which lets teams launch their own POL-secured chains that plug into it.
POL is the token that ties this together. Since the September 2024 migration, one asset pays gas on Polygon PoS, secures the network through staking, and grants governance across the ecosystem — MATIC’s roles carried over 1:1, but POL is built to secure many chains at once rather than one. On the supply side, POL launched with an initial 10 billion tokens and roughly 10.7 billion in circulation, and it carries a fixed 2% annual emission for its first decade: 1% to validator and staking rewards, 1% to a community treasury that funds ecosystem growth. Governance can lower those rates but never raise them. Native staking currently yields in the region of 4–5% a year, which gives holders a reason to lock tokens up and thins the float that can be sold. Where Polygon has pushed hardest lately is real usage over speculation — stablecoin payments, consumer apps, and tokenized real-world assets settling on its chains — and that adoption, not a token unlock or a halving, is the fundamental worth tracking for POL.
Upcoming catalysts
Only confirmed, dated events are listed. Macro policy is the clearest near-term driver, given how closely POL now tracks risk assets and the Fed’s rate path.
| Date | Event | Potential impact |
|---|---|---|
| September 15–16, 2026 | FOMC meeting (with economic projections) | Bull if the Fed signals cuts; bear if it holds rates higher for longer |
| October 27–28, 2026 | FOMC meeting | Rate path steers risk appetite across the alt and layer-2 cohort |
| December 8–9, 2026 | FOMC meeting (with economic projections) | Year-end policy signal that frames 2027 positioning |
| 2026 (no fixed date) | Polygon Gigagas roadmap milestones (post-Rio scaling toward 100k TPS) | Higher throughput and lower fees; listed without a date because none is confirmed |
FOMC dates follow the Federal Reserve’s published 2026 schedule. Polygon’s Gigagas scaling milestones are included without a date because the team has set a throughput ambition, not a confirmed mainnet date for the next step — a made-up date would be a guess, not information.
Bull case vs bear case
Bull case:
- Polygon 2.0 and the AggLayer turn scattered chains into one network, and cross-chain usage feeds demand for POL.
- Payments, stablecoins, and tokenized real-world assets keep settling on Polygon, giving POL utility beyond trading.
- The Fed shifts to cuts, risk appetite returns, and high-beta layer-2 tokens catch a broad alt bid.
- Staking keeps locking up supply, thinning the float available to sell into strength.
Bear case:
- Rival layer-2s and alternative L1s keep taking share, and Polygon’s activity stalls.
- Rates stay higher for longer, keeping speculative alts under pressure.
- POL keeps trading below its 200-day average, and the 2% annual emission drips new supply into a weak bid.
- The Ethereum scaling narrative cools, dragging the whole L2 cohort down with it.
Invalidation levels. The bull case loses its footing if POL closes below the $0.069 support, and a break of $0.064 under it would confirm the downtrend has more room to run. The bear case is invalidated on a sustained push above the 200-day zone near $0.090–$0.092 — the line that has capped every rally attempt — with a close above $0.095 turning the medium-term structure constructive. Both triggers come straight from the levels in the technical section above.
Historical performance
Polygon’s chart is a boom-and-collapse story, not a steady climb. The token launched in 2019 at a fraction of a cent, ran to $2.92 by December 2021 during the last great alt mania, then gave almost all of it back — a drawdown north of 95% that left it near $0.075 in mid-2026, below both its own long-term average and the highs it made as MATIC. Each of Polygon’s up-moves has come with the broad crypto tide rather than in isolation, and nothing about the past guarantees the next cycle repeats the shape of the last.
Is Polygon a good investment in 2026?
Whether POL fits a portfolio comes down to horizon and appetite for risk. PrimeXBT’s outlook sees it roughly basing in 2026 — a ~$0.082 average, a token steadying rather than surging — with the harder question being whether Polygon’s payments-and-scaling push converts into lasting demand for the token. The setup cuts both ways: POL sits near multi-year lows with real technology and adoption behind it, which reads as opportunity to some and as a falling knife to others. PrimeXBT’s explainer on what Polygon and POL actually are, and its Polygon versus Ethereum comparison, lay out the case in more depth.
How to trade Polygon on PrimeXBT
On PrimeXBT you can take a position on Polygon in either direction. CFDs on POL can be traded long or short, so a view that the token keeps sliding is as tradable as a view that it recovers — see PrimeXBT’s guide to short selling for how the downside side works. Leverage magnifies gains and losses alike, so position sizing and a stop-loss matter on every trade. Trade on your own analysis and risk tolerance, and never stake more than you can afford to lose.
Trading involves risk.
How we build this forecast
This outlook is assembled by PrimeXBT’s analysts, not copied from a single price feed. We start from where POL trades today, place it against its 50- and 200-day moving averages and the support and resistance levels that keep repeating, weigh the fundamentals — staking demand, the 2% emission schedule, AggLayer traction, and real payments and RWA usage — and set all of it against the macro backdrop, chiefly the path of US interest rates. The yearly ranges blend that technical read with the fundamental and macro picture; the long-range figures lean on trajectory rather than precision.
None of this is a guarantee. Polygon is volatile, the inputs shift, and a single macro surprise or a change in the layer-2 race can move POL faster than any model expects. Treat every figure here as a considered estimate rather than a promise — we revisit and update the outlook monthly as the data changes.
How much will Polygon (POL) be worth in 2026?
PrimeXBT's outlook is $0.069–$0.096 for 2026, averaging near $0.082 — a year of trying to base out rather than break higher.
How much will Polygon be worth in 2030?
PrimeXBT's long-range view is $0.152–$0.270, averaging near $0.21. A POL figure this far out carries low confidence, so read it as a direction rather than a target.
What will Polygon be worth in five years?
See 2030 above. On this horizon any single figure is a slope, not a promise, and the plausible range is wide.
How much will Polygon be worth in 5 years?
Five years from now, MATIC should continue to increase in value, with most people believing that the price of Polygon should be somewhere in the neighborhood of $3.50. A MATIC price prediction is difficult in these times, but as crypto regains its footing, a lot of developers will be looking at Polygon.
Is it a good time to buy MATIC?
This isn’t a simple yes or no answer; it is about your investing horizon. If you are looking for a longer-term investment, then the entry point probably isn’t as important to you as it would be for a short-term trader. That said, you probably have plenty of time to accumulate while the world deals with the fallout from the Crypto bubble.
Can Polygon reach $1 or $10?
Not on PrimeXBT's numbers this decade. The peak of the modeled path is an average near $0.24 in 2029, and even the long-range 2050 figure sits below $1. POL last traded near $1 and above as MATIC in 2021; returning there would take a stronger cycle than the current picture shows, and $10 is far beyond any level Polygon has reached.
Author



 Risk Disclaimer
The content provided here is for informational purposes only. It is not intended as personal investment advice and does not constitute a solicitation or invitation to engage in any financial transactions, investments, or related activities. Past performance is not a reliable indicator of future results.
The financial products offered by the Company are complex and come with a high risk of losing money rapidly due to leverage. These products may not be suitable for all investors. Before engaging, you should consider whether you understand how these leveraged products work and whether you can afford the high risk of losing your money.
The Company does not accept clients from the Restricted Jurisdictions as indicated in our website/ T&C. Some services or products may not be available in your jurisdiction.
The applicable legal entity and its respective products and services depend on the client’s country of residence and the entity with which the client has established a contractual relationship during registration.