15 min read
 Injective (INJ) is a layer-1 blockchain built for one job: finance. It runs on-chain order-book exchanges, derivatives, and tokenized real-world assets rather than the general-purpose app layer most chains chase. INJ is the token that secures the network through staking, pays for its markets, and sits at the center of a weekly-then-monthly buyback that burns supply. The coin trades near $4.46 in August 2026, roughly 92% below its March 2024 record — a long way down, and the reason a forecast has to start with what the network actually does, not with the last cycle’s high. This page sets out PrimeXBT’s outlook for INJ through 2030 and out to 2050: the levels traders are watching, the catalysts that matter, and where the honest uncertainty sits.
Injective outlook at a glance
- Current price: $8.742 per INJ.
- 2026 base case: $4.10–$7.20, a recovery off the lows rather than a return to prior highs.
- Main bullish catalyst: Injective’s native EVM mainnet and RWA module drawing on-chain finance activity, with the monthly buyback thinning supply.
- Biggest downside risk: a sustained break of the $4.12 200-day average and the $4.26 support, opening the door back toward the $2.65 zone.
- Long-term view: the multi-year path trends higher on a finance-specific niche, but anything past 2030 is a direction of travel, not a target.
Live Injective price chart
Today (21 October 2026) Injective (INJ/USD) is trading at $8.742 per INJ, with a market cap of $871,441,110 USD. The 24-hour trading volume amounts to $159,008,629 USD. INJ price has changed by -1.90% in the last 24 hours. Injective’s circulating supply is 99,970,954 INJ.
Trading involves risk.
Injective price prediction 2026–2030 (yearly forecast)
The table below is PrimeXBT’s expected range for each year, derived from the month-by-month path in the sections that follow. Longer-horizon views from algorithmic models diverge sharply on Injective, so those are kept apart in the analyst section rather than blended into this range.
| Year | Minimum | Average | Maximum |
|---|---|---|---|
| 2026 | $4.10 | $5.48 | $7.20 |
| 2027 | $6.32 | $8.86 | $11.79 |
| 2028 | $9.72 | $13.30 | $16.45 |
| 2029 | $9.26 | $12.18 | $15.37 |
| 2030 | $8.27 | $10.98 | $13.50 |
Injective price prediction 2026
PrimeXBT’s 2026 outlook centers on an average near $5.50, inside a full-year range of $4.10–$7.20. That is a recovery off the summer lows, not a new bull market: INJ enters the second half of 2026 below its 50-day average with fearful sentiment, so the base case is a grind higher toward the mid-$6 area by year-end rather than a vertical move. The forecast covers the forward months only; the part of 2026 already behind us is history, not prediction.
| Month (2026) | Minimum | Average | Maximum |
|---|---|---|---|
| August | $4.10 | $4.46 | $4.82 |
| September | $4.52 | $4.93 | $5.34 |
| October | $4.94 | $5.40 | $5.86 |
| November | $5.47 | $6.00 | $6.53 |
| December | $6.00 | $6.60 | $7.20 |
Injective price prediction 2027
2027 is the year the outlook expects the trend to turn convincingly. The average lands near $9.00 across a range of $6.32–$11.79, with the path building through the year rather than spiking on a single event. The step up rests on the native EVM ecosystem maturing and buyback-driven supply pressure compounding, not on a broad altcoin mania that may or may not arrive.
| Month (2027) | Minimum | Average | Maximum |
|---|---|---|---|
| January | $6.32 | $6.97 | $7.62 |
| February | $6.63 | $7.34 | $8.04 |
| March | $6.95 | $7.71 | $8.47 |
| April | $7.26 | $8.08 | $8.90 |
| May | $7.57 | $8.45 | $9.33 |
| June | $7.87 | $8.82 | $9.76 |
| July | $8.13 | $9.14 | $10.14 |
| August | $8.35 | $9.41 | $10.47 |
| September | $8.57 | $9.68 | $10.80 |
| October | $8.78 | $9.95 | $11.13 |
| November | $9.00 | $10.23 | $11.46 |
| December | $9.21 | $10.50 | $11.79 |
Injective price prediction 2028
2028 is the cycle-high year in PrimeXBT’s model: an average near $13.30 within a range of $9.72–$16.45, with the peak forming mid-year before the market cools. This is where the forecast places the next cyclical top for INJ, roughly in line with the broader crypto four-year rhythm that has historically topped in the year or two after a Bitcoin halving.
| Month (2028) | Minimum | Average | Maximum |
|---|---|---|---|
| January | $9.72 | $11.12 | $12.51 |
| February | $10.22 | $11.73 | $13.24 |
| March | $10.73 | $12.35 | $13.97 |
| April | $11.23 | $12.96 | $14.70 |
| May | $11.72 | $13.58 | $15.43 |
| June | $12.22 | $14.19 | $16.17 |
| July | $12.36 | $14.41 | $16.45 |
| August | $12.17 | $14.23 | $16.28 |
| September | $11.98 | $14.05 | $16.11 |
| October | $11.78 | $13.86 | $15.94 |
| November | $11.59 | $13.68 | $15.77 |
| December | $11.40 | $13.50 | $15.60 |
Injective price prediction 2029
2029 reads as the cool-down after the peak — an average near $12.00 across a range of $9.26–$15.37, easing lower through the year. A gentle retracement rather than a collapse: the network keeps its finance niche and its deflationary mechanics, but price gives back part of the cycle advance as momentum fades.
| Month (2029) | Minimum | Average | Maximum |
|---|---|---|---|
| January | $11.17 | $13.27 | $15.37 |
| February | $10.94 | $13.04 | $15.13 |
| March | $10.71 | $12.81 | $14.90 |
| April | $10.49 | $12.58 | $14.67 |
| May | $10.26 | $12.35 | $14.43 |
| June | $10.04 | $12.12 | $14.19 |
| July | $9.86 | $11.95 | $14.03 |
| August | $9.74 | $11.84 | $13.93 |
| September | $9.62 | $11.73 | $13.83 |
| October | $9.50 | $11.62 | $13.74 |
| November | $9.38 | $11.51 | $13.64 |
| December | $9.26 | $11.40 | $13.54 |
Injective price prediction 2030
By 2030 the outlook settles around an average near $11.00, inside a range of $8.27–$13.50. Five years out, trajectory matters more than any single monthly figure, so treat the path below as the shape of a post-peak plateau rather than a set of dated targets. This is also where model disagreement is widest — see the analyst comparison for why.
| Month (2030) | Minimum | Average | Maximum |
|---|---|---|---|
| January | $9.18 | $11.34 | $13.50 |
| February | $9.10 | $11.28 | $13.45 |
| March | $9.02 | $11.22 | $13.41 |
| April | $8.94 | $11.15 | $13.37 |
| May | $8.86 | $11.09 | $13.32 |
| June | $8.78 | $11.03 | $13.28 |
| July | $8.70 | $10.96 | $13.23 |
| August | $8.61 | $10.89 | $13.17 |
| September | $8.53 | $10.82 | $13.11 |
| October | $8.44 | $10.75 | $13.05 |
| November | $8.35 | $10.67 | $12.99 |
| December | $8.27 | $10.60 | $12.93 |
Injective long-term price prediction: 2035, 2040–2050
Put a number on INJ in 2050 and you are really guessing at three more halving cycles, a decade of interest-rate regimes, and technologies nobody has built yet. Every figure this far out carries error bars that widen with each year, so the long-range view is a slope, not a promise. On that basis PrimeXBT’s path trends higher without hockey-sticking: an average near $18 by 2035, near $26 by 2040, and near $35 by 2050 — steady appreciation that assumes Injective keeps its place as a working finance chain, and nothing more dramatic.
| Year | Minimum | Average | Maximum |
|---|---|---|---|
| 2035 | $13.32 | $18.00 | $22.68 |
| 2040 | $17.68 | $26.00 | $34.32 |
| 2050 | $21.00 | $35.00 | $49.00 |
What analysts and models say (compared)
Injective is a small enough asset that no major bank or fund publishes a price target for it — unlike Bitcoin or Ethereum, the comparison here is between algorithmic forecasting models, which agree on direction and disagree on almost everything else. For 2026 they cluster in the high-$6 to high-$7 range; by 2030 they split by a factor of nearly three.
| Source | Method | Injective view |
|---|---|---|
| CoinCodex | Algorithmic | 2026 avg ~$7.76 (range $4.45–$10.83); 2028 avg ~$24; 2030 avg ~$11.47 |
| Changelly | Algorithmic | 2026 avg ~$6.73; 2028 avg ~$14.66; 2030 avg ~$31.03 |
| PrimeXBT | Synthesis (technical + fundamental + macro) | 2026 avg ~$5.50; 2028 avg ~$13.30 (peak); 2030 avg ~$11 |
The 2030 gap is the story. CoinCodex sees INJ peaking around 2028 and easing to roughly $11 by decade’s end; Changelly models a straight climb to about $31. They rest on incompatible assumptions about how far this cycle runs, and averaging them would invent a consensus that does not exist. PrimeXBT’s own numbers sit at or below the more cautious of the two, reflecting a coin that still trades 92% under its record and has to earn a re-rating rather than being handed one.
Track record of this forecast
This is the first published PrimeXBT price forecast for Injective, so there is no prior call to grade yet. From the next monthly review onward, this section will line up the previous forecast against INJ’s actual price on the update date and account for any miss in plain terms, rather than quietly revising the target and moving on.
Injective technical analysis
Injective trades at $4.46 in August 2026, wedged between its two most-watched averages. It sits above the 200-day simple moving average of $4.12, which shows the longer trend has stabilized off the lows, but below the 50-day average of $4.82, a sign short-term momentum has softened in recent weeks. Notably, the 50-day now sits above the 200-day — a structure that usually marks an improving trend even when price is temporarily below both lines. The 14-day RSI reads around 34, closer to oversold than overbought, and the Fear & Greed Index sits at 30 (Fear).
The support and resistance levels that matter now: support at $4.26, then the 200-day line at $4.12, with a deeper demand zone around $2.65–$2.73 if those give way; resistance at the 50-day average of $4.82, then a band at $5.43–$5.50, with the next real ceiling near $6.38. Reclaiming the 50-day and holding above $5.50 would be the clearest signal that the summer downtrend has broken. For a primer on reading these signals, see PrimeXBT’s guide to crypto technical analysis, and how the two moving averages frame the trend.
Correlation with other assets
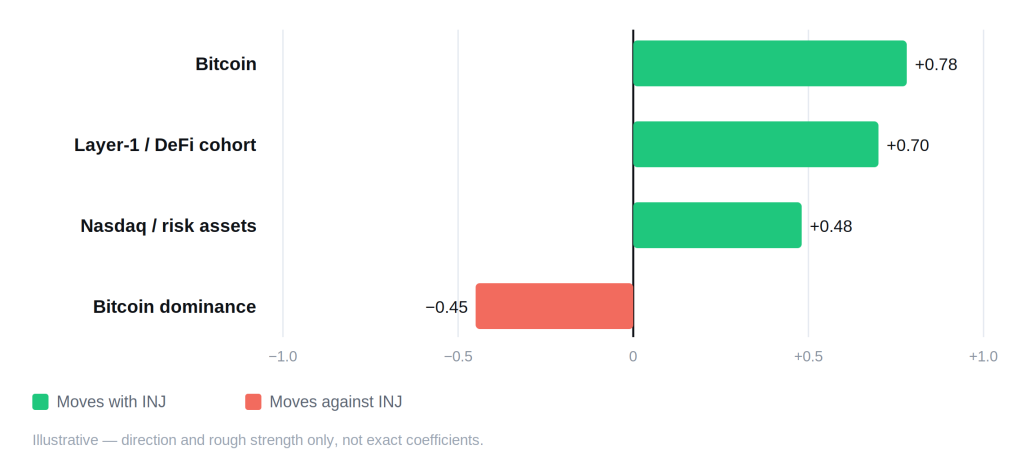
Injective trades as a high-beta altcoin, which means it amplifies Bitcoin’s moves in both directions and rarely fights the broad tape for long. When capital rotates toward Bitcoin and Bitcoin dominance climbs, INJ and the rest of the layer-1 and DeFi cohort tend to underperform; when money rotates back down the risk curve into alts, INJ tends to lead its group rather than lag it. Since institutions started pricing crypto against equities, the coin also tracks the Nasdaq more closely than it once did, so Federal Reserve policy reaches INJ through the same risk-on channel it reaches tech stocks. What sets Injective apart from a generic alt is a second, coin-specific driver: news about its own ecosystem — the EVM rollout, RWA listings, buyback size — can pull the price away from the pack for days at a time. Injective has no safe-haven story; it does not trade with gold, and its link to the dollar index runs only through the general risk-on channel, not as a currency hedge.
Fundamental factors
Injective is a layer-1 blockchain purpose-built for finance, not a general smart-contract platform that happens to host some DeFi. Its base layer ships on-chain order books, a derivatives engine, and a real-world-asset module, so trading venues, perpetuals, and tokenized instruments are native infrastructure rather than third-party apps. The chain was built with the Cosmos SDK and Tendermint proof-of-stake, is IBC-connected to the wider Cosmos ecosystem, and was founded in 2018 by Eric Chen and Albert Chon under Injective Labs, incubated through the Binance Labs program, with mainnet live since 2021.
The change that reshaped the 2026 story is the native EVM mainnet, which went live on November 11, 2025. It makes Injective a multi-VM chain — developers can build in both WebAssembly and the Ethereum Virtual Machine over shared liquidity, with a Solana VM on the roadmap — and it runs at roughly 0.64-second block times and fractions of a cent per transaction. Alongside it, Injective’s RWA module lets issuers tokenize traditional assets on-chain: the network already tracks tokenized Treasury bills, synthetic equity and commodity exposure, and pre-IPO markets, which is the on-chain-finance narrative the token is increasingly priced against.
Supply is the other half of the thesis. INJ launched with a 100 million base and circulating supply now sits near that figure, but the token is designed to shrink. Injective’s signature deflationary mechanism began as a weekly burn auction and was restructured into a monthly Community BuyBack in October 2025, routing a large share of ecosystem fees into buying back and permanently burning INJ; the INJ 3.0 upgrade in 2024 sharpened the schedule and lifted the deflation rate. More than seven million INJ have been burned to date. Because staking issuance still adds tokens, INJ is not continuously deflationary the way a hard cap would be, but net issuance is low and turns negative in months when burns outrun new supply — a genuine difference from most inflationary layer-1s.
Upcoming catalysts
Only confirmed, dated events are listed. With INJ tracking risk assets, U.S. monetary policy is the clearest near-term driver; the buyback is the clearest coin-specific one.
| Date | Event | Potential impact |
|---|---|---|
| September 15–16, 2026 | FOMC meeting (with economic projections) | Bull if the Fed signals cuts; bear if it holds rates higher for longer |
| October 27–28, 2026 | FOMC meeting | Rate path steers risk appetite across the alt market |
| December 8–9, 2026 | FOMC meeting (with economic projections) | Year-end policy signal for 2027 positioning |
| Monthly (ongoing) | Injective Community BuyBack and burn | Recurring supply removal; larger burns tend to support price |
FOMC dates follow the Federal Reserve’s published 2026 schedule. The Community BuyBack runs on a monthly cadence, but the exact date and size of each round are set close to the event, so it is listed by its confirmed frequency rather than a guessed date.
Bull case vs bear case
Bull case:
- The native EVM mainnet pulls Ethereum developers and liquidity onto Injective, widening the fee base that funds the burn.
- RWA and tokenized-market adoption gives INJ a real revenue narrative that most alts lack.
- Monthly buybacks outpace staking issuance, tipping supply net-negative in active months.
- The Fed shifts to cuts and capital rotates back down the risk curve into layer-1 alts.
Bear case:
- Rates stay higher for longer, keeping high-beta alts like INJ under pressure.
- EVM launch fails to convert into durable on-chain activity, and fees stay thin.
- Bitcoin dominance keeps rising, and INJ bleeds against it alongside the rest of the cohort.
- Price loses the 200-day average and the summer support gives out.
Invalidation levels. The bull case weakens on a sustained close below the 200-day average at $4.12, and more decisively below the $2.65–$2.73 demand zone. The bear case is invalidated on a clean reclaim of the 50-day average at $4.82 followed by acceptance above the $5.43–$5.50 band — roughly 20% above the current price, and the line that would confirm the downtrend has turned. These triggers are the same support and resistance levels named in the technical section, applied as decision points rather than forecasts.
Historical performance
Injective’s chart is a story of one violent cycle, not a steady climb. INJ ran from cents in 2021 to an all-time high of $52.62 on March 14, 2024, then gave back the overwhelming majority of that move; in August 2026 it trades near $4.46, about 92% below the peak and below where it started the year. That kind of drawdown is normal for a small-cap layer-1 after a blow-off top, and it cuts both ways — the same volatility that erased the 2024 gains is what makes a recovery cycle plausible. No cycle is obliged to rhyme with the last one, and a return to the old high would take a far larger move than anything in this forecast.
Is Injective a good investment in 2026?
Injective in 2026 is a bet on one specific idea: that a blockchain built only for finance, with a shrinking token supply, earns a re-rating as tokenized markets grow. The bull evidence is concrete — a live EVM mainnet, a working RWA module, and a buyback that has burned more than seven million INJ. The caution is just as concrete: the coin sits 92% below its high, momentum is soft, sentiment reads as fear, and PrimeXBT’s own base case sees only a partial recovery in 2026, averaging near $5.50. Whether that risk-reward suits you comes down to conviction in the finance-chain thesis and tolerance for high-beta swings. This page is analysis, not advice.
How to trade Injective on PrimeXBT
On PrimeXBT you can take a position on Injective in either direction. CFDs on INJ can be traded long or short, so you are not limited to betting the price rises — short selling lets you position for a decline too. Leverage magnifies gains and losses alike, so position sizing and a stop-loss matter on every trade, especially on a coin as volatile as this one. Trade on your own analysis and risk tolerance, and never risk more than you can afford to lose.
Trading involves risk.
How we build this forecast
This outlook is put together by PrimeXBT’s analysts, not copied from a single price feed. We start from where INJ trades today, read its position against the 50- and 200-day moving averages and the key support and resistance levels, weigh the fundamentals — the native EVM launch, the RWA module, staking issuance, and the monthly buyback — and set all of it against the macro backdrop, mainly the path of U.S. interest rates and Bitcoin dominance. The yearly ranges combine that technical read with the fundamental and macro picture; the long-range figures lean on trajectory rather than precision.
None of this is a guarantee. Injective is a high-beta, small-cap asset, the inputs shift constantly, and one macro surprise or ecosystem headline can move it faster than any model expects. Treat every figure here as a considered estimate, not a promise — we revisit and update the outlook monthly as the data changes.
How much will Injective be worth in 2026?
PrimeXBT's outlook averages near $5.50 for 2026, a partial recovery off the summer lows rather than a return to prior highs.
How much will Injective be worth in 2030?
The 2030 view averages near $11, though forecasting models diverge widely at this horizon — one respected model sees roughly $11 while another sees about $31. Read the number as a direction, not a target.
Can Injective reach $100?
Not on these numbers. The top of PrimeXBT's modeled range through 2050 sits in the mid-$30s, and even INJ's 2024 record of $52.62 is well under $100. Reaching triple digits would require a cycle far larger than anything in this forecast.
How does the Injective burn affect the price?
Injective routes a large share of ecosystem fees into a monthly Community BuyBack that permanently burns INJ, and more than seven million tokens have been removed so far. When burns outrun new staking issuance, supply shrinks, which can support the price over time — but the burn alone does not override macro conditions or demand.
Author



 Risk Disclaimer
The content provided here is for informational purposes only. It is not intended as personal investment advice and does not constitute a solicitation or invitation to engage in any financial transactions, investments, or related activities. Past performance is not a reliable indicator of future results.
The financial products offered by the Company are complex and come with a high risk of losing money rapidly due to leverage. These products may not be suitable for all investors. Before engaging, you should consider whether you understand how these leveraged products work and whether you can afford the high risk of losing your money.
The Company does not accept clients from the Restricted Jurisdictions as indicated in our website/ T&C. Some services or products may not be available in your jurisdiction.
The applicable legal entity and its respective products and services depend on the client’s country of residence and the entity with which the client has established a contractual relationship during registration.