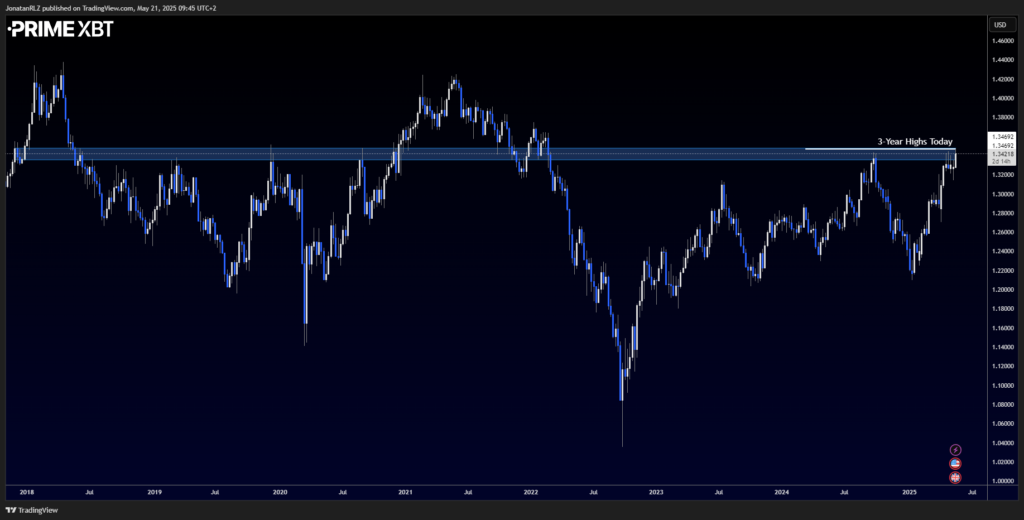
The British pound saw a sharp surge in volatility today following the release of the UK inflation figures. The year-on-year CPI came in at 3.5%, higher than both the previous reading of 2.6% and the forecast of 3.3%. This hotter-than-expected print sent GBP/USD rallying into price territory not seen since 2022, fuelling speculation of potential policy shifts from the Bank of England and raising questions around the strength of the breakout move.
Although the initial surge has slowed and price is currently reacting to a local resistance area, the question now becomes: is this move a classic post-data fakeout, or the beginning of a broader cycle for GBP/USD?

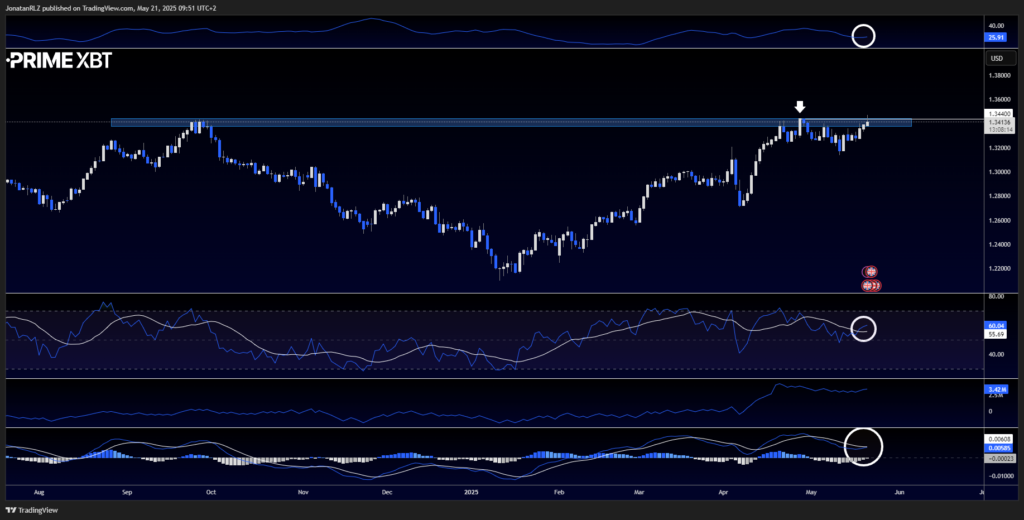
On the daily chart, GBP/USD is currently showing what could turn into a classic fake-out move. However, it’s worth noting that the daily candle won’t close for another 13 hours at the time of writing, and a lot can change before then. For this to be confirmed as a fake-out, we’d likely want to see a close below the recent local highs at 1.3440.
There are no obvious signs of divergence or weakness on the daily indicators. The MACD appears close to printing a bullish signal, and the On Balance Volume (OBV) continues to reflect steady bullish momentum. The RSI shows strength with no signs of bearish divergence, and the ADX, sitting above 20, is beginning to slope upwards, suggesting a healthy trend.

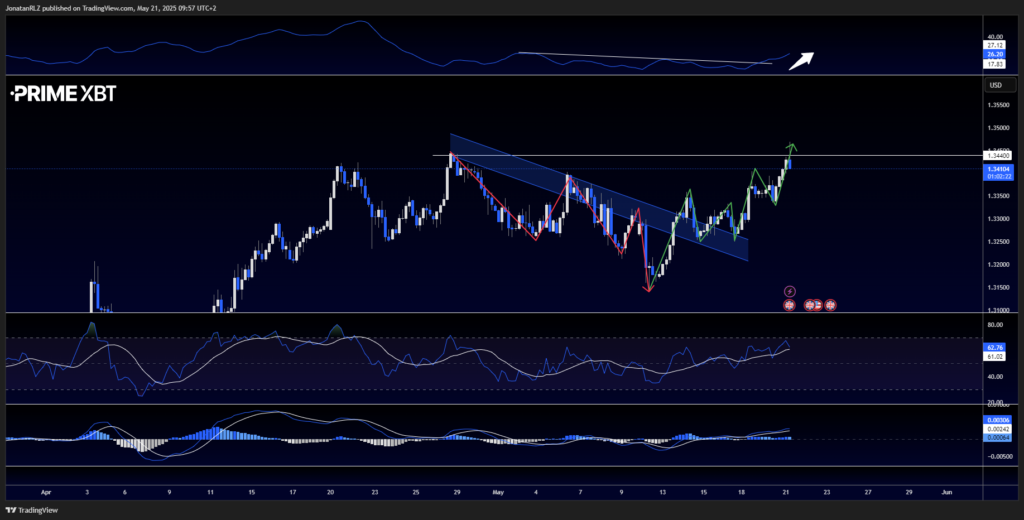
Dropping down to the 4-hour chart, GBP/USD recently shifted into a more bullish structure. This is marked by a change in price behaviour following the red arrows indicating bearish structure, and the green line showing the shift into bullish territory. Again, the MACD and RSI are showing no bearish divergence, and the ADX is breaking a trendline to the upside, suggesting that trend strength is returning.

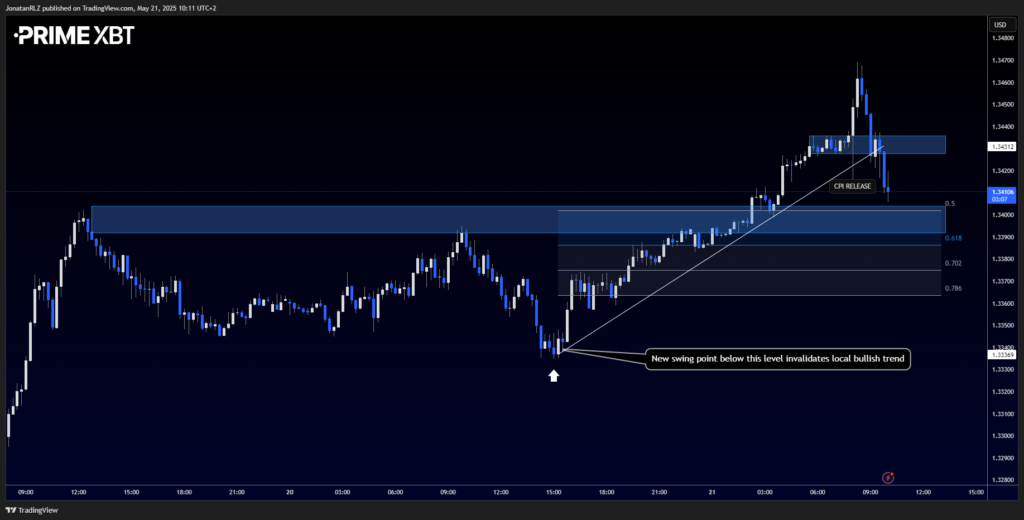
Zooming into the 15-minute chart, we see that the level where GBP/USD was trading at the time of the CPI release failed to hold as support. It’s common during unexpected, high-impact news events such as inflation data for volatility to spike sharply. Often, markets will return to retest the level they were trading at during the release. If the move is genuine, that level frequently acts as support.
In GBP/USD’s case, that level broke, along with the local trendline marked in white. We now turn our attention to the 50% Fibonacci retracement of the latest upward leg, which comes in around 1.3400. This may act as support if the pair is to attempt another leg higher. Still, the local structure suggests there’s a reasonable probability that this move could end up being a CPI-driven fake-out.
This is a textbook example of why trading during news events can be risky, as the aggressive intraday volatility often takes out stops for both bulls and bears before choosing a clearer direction.

Trade GBP/USD
Trading involves risk.
The content provided here is for informational purposes only. It is not intended as personal investment advice and does not constitute a solicitation or invitation to engage in any financial transactions, investments, or related activities. Past performance is not a reliable indicator of future results.
The financial products offered by the Company are complex and come with a high risk of losing money rapidly due to leverage. These products may not be suitable for all investors. Before engaging, you should consider whether you understand how these leveraged products work and whether you can afford the high risk of losing your money.
The Company does not accept clients from the Restricted Jurisdictions as indicated in our website/ T&C. Some services or products may not be available in your jurisdiction.
The applicable legal entity and its respective products and services depend on the client’s country of residence and the entity with which the client has established a contractual relationship during registration.


