5 min read
 Ethereum has dropped below the $2,000 level, leading a broad sell-off across the crypto market during the overnight Asian session. The move did not appear to be driven by anything specific to Ethereum. It came instead as part of a wider risk-off shift that pulled most major tokens lower.
What’s driving the move
The trigger appears to be a fresh escalation in the US-Iran conflict. A fresh round of US airstrikes near the Strait of Hormuz reversed the ceasefire optimism that had been building earlier in the week, when hopes of progress towards a lasting deal had helped lift risk assets.
The reaction followed a familiar pattern:
- Oil moved higher on renewed concern over supply through the Strait of Hormuz, a chokepoint for a large share of global energy trade.
- Equities turned lower and US Treasury yields firmed as risk appetite faded.
- Crypto took the move hardest. As one of the higher-beta corners of the market, it tends to react sharply when risk sentiment deteriorates.
The sell-off was amplified by leverage. Around $1 billion in leveraged crypto positions were liquidated over 24 hours, the bulk of them long positions, which added fuel to the downside as stops were triggered.
Bitcoin slipped below $73,000 for the first time in months, while Ethereum fell below $2,000 for the first time since late March. The conflict itself is not new. A fragile ceasefire has held since early April, punctuated by periodic strikes, with the two sides still at odds over the terms of a lasting deal. Each headline that shifts the odds continues to move risk assets in both directions, and overnight the swing was to the downside.
Ethereum weekly chart
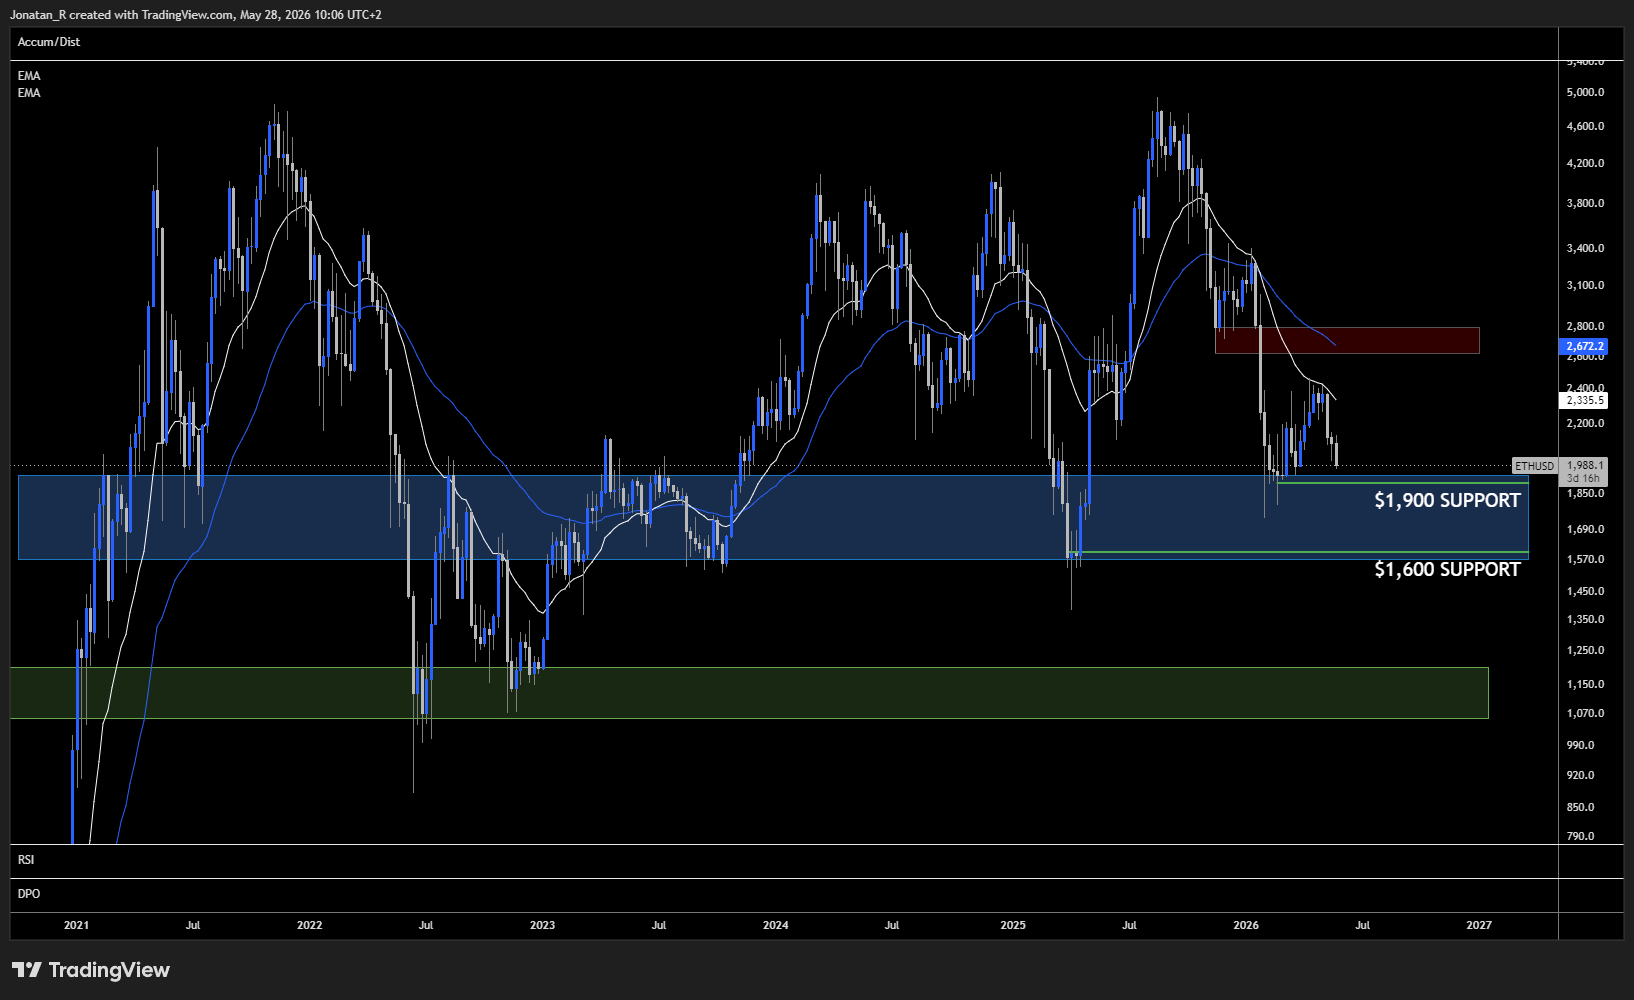
On the weekly timeframe, Ethereum saw a heavy rejection when it reached the weekly 20 EMA around $2,450 in late April, and price has trended lower since.
- Price has now broken below the $2,000 level.
- The closest immediate support on the high timeframe sits at $1,900, with the next level below at $1,600.
- The area between $1,900 and $1,600 is a major high-timeframe support zone that has held price since March 2023.
Ethereum daily chart
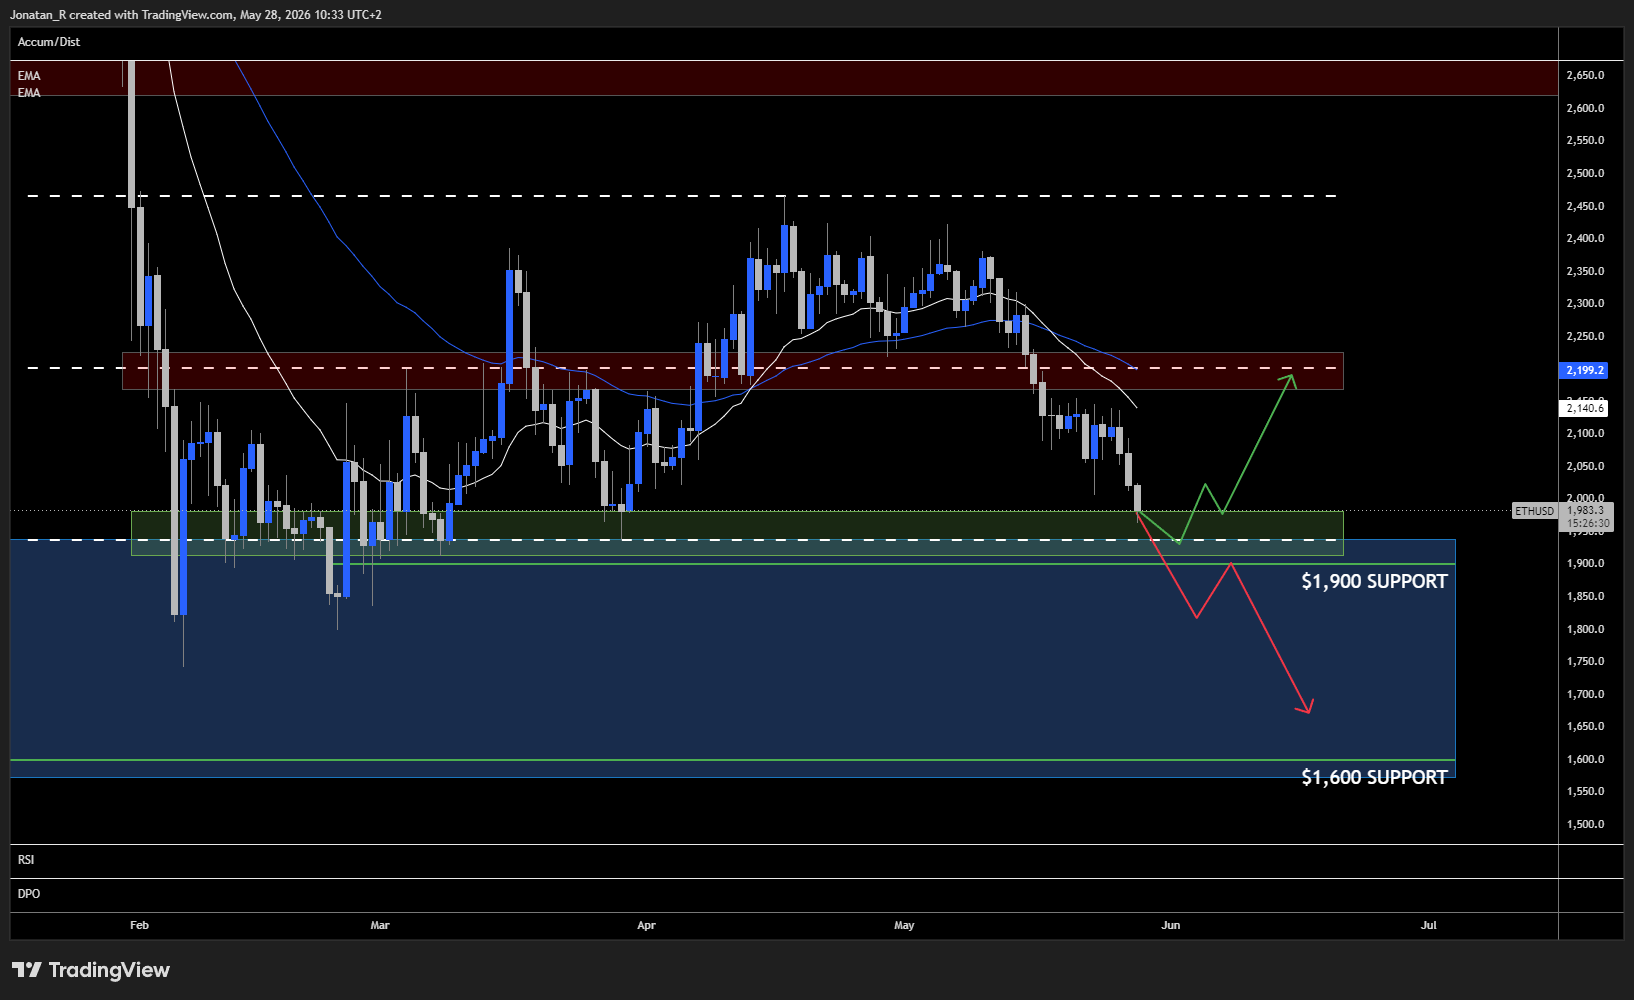
On the daily timeframe, Ethereum is currently testing the lower boundary of its recent range.
- The range high sits around $2,450, with equilibrium near $2,200 and the range low between $1,900 and $2,000.
- The $2,200 equilibrium is confluent with the 20 and 50 EMA on the daily, which could act as resistance on any move higher.
- A break below the range low could potentially open the way towards the $1,600 level, making the current zone a crucial area for buyers to defend.
For now, Ethereum is sitting right at a level that has defined the lower end of its range. Whether it holds or gives way could set the tone for the next move, and with the macro backdrop still driven by headlines out of the Middle East, volatility could remain elevated.
Trading involves risk.
Author



 Risk Disclaimer
The content provided here is for informational purposes only. It is not intended as personal investment advice and does not constitute a solicitation or invitation to engage in any financial transactions, investments, or related activities. Past performance is not a reliable indicator of future results.
The financial products offered by the Company are complex and come with a high risk of losing money rapidly due to leverage. These products may not be suitable for all investors. Before engaging, you should consider whether you understand how these leveraged products work and whether you can afford the high risk of losing your money.
The Company does not accept clients from the Restricted Jurisdictions as indicated in our website/ T&C. Some services or products may not be available in your jurisdiction.
The applicable legal entity and its respective products and services depend on the client’s country of residence and the entity with which the client has established a contractual relationship during registration.