13 min read
 Bitcoin Cash (BCH) trades near $214 in early August 2026, more than 95% below the $4,358 record it set in December 2017 and still stuck below its own long-term trend. BCH is a proof-of-work cryptocurrency that split from Bitcoin in a 2017 hard fork to move payments on-chain with cheaper, faster blocks. This page lays out PrimeXBT’s price outlook for Bitcoin Cash through 2030 and out to 2050, the levels traders are watching right now, and the events that could shift the trend. Where a number would be a guess rather than a read, the text says so plainly.
Bitcoin Cash outlook at a glance
- 2026 base case: $196.88–$278.84, a year of basing near current levels rather than a fresh trend.
- Main bullish catalyst: the next Bitcoin Cash halving, expected in 2028, which historically tightens new supply ahead of the wider crypto cycle.
- Biggest downside risk: Bitcoin capital staying concentrated in BTC itself, with BCH slipping below the $207 support and drifting.
- Long-term view: the multi-year path bends higher on the halving rhythm, but anything past 2030 is a direction of travel, not a target.
Live Bitcoin Cash price chart
Trading involves risk.
Bitcoin Cash price prediction 2026–2030 (yearly forecast)
The table sets PrimeXBT’s expected range for each year, built from a single continuous monthly path so the yearly figures and the month-by-month tables below never contradict each other. Longer-horizon institutional views, which rest on very different assumptions, sit in the analyst section rather than getting blended in here.
| Year | Minimum | Average | Maximum |
|---|---|---|---|
| 2026 | $196.88 | $235.00 | $278.84 |
| 2027 | $238.72 | $298.03 | $368.58 |
| 2028 | $304.20 | $423.29 | $560.86 |
| 2029 | $430.40 | $547.83 | $677.47 |
| 2030 | $352.00 | $473.36 | $601.76 |
Bitcoin Cash price prediction 2026
PrimeXBT’s 2026 outlook keeps BCH close to its early-August level near $214, a range of roughly $196.88–$278.84 with an average near $235. That is a coin building a base after a heavy year, not one breaking into a new uptrend. Extreme-fear sentiment and a price below the 200-day average argue for patience over the next few quarters.
For the rest of 2026, the month-by-month view holds BCH in a narrow, faintly rising band as the market waits for the next Bitcoin move:
| Month (2026) | Minimum | Average | Maximum |
|---|---|---|---|
| August | $196.88 | $214.00 | $231.12 |
| September | $206.02 | $224.50 | $242.98 |
| October | $215.12 | $235.00 | $254.88 |
| November | $224.16 | $245.50 | $266.84 |
| December | $233.16 | $256.00 | $278.84 |
Bitcoin Cash price prediction 2027
2027 reads as the recovery year: the path lifts off the 2026 base toward an average near $300, with a full-year range of about $238.72–$368.58. The step up rests on the approach of the 2028 halving and firmer conditions across proof-of-work coins, not a single headline.
| Month (2027) | Minimum | Average | Maximum |
|---|---|---|---|
| January | $238.72 | $262.77 | $286.82 |
| February | $244.24 | $269.54 | $294.83 |
| March | $249.74 | $276.31 | $302.88 |
| April | $255.20 | $283.08 | $310.95 |
| May | $260.64 | $289.85 | $319.05 |
| June | $266.04 | $296.62 | $327.19 |
| July | $270.82 | $302.73 | $334.63 |
| August | $274.99 | $308.18 | $341.37 |
| September | $279.14 | $313.64 | $348.14 |
| October | $283.25 | $319.09 | $354.93 |
| November | $287.35 | $324.55 | $361.74 |
| December | $291.42 | $330.00 | $368.58 |
Bitcoin Cash price prediction 2028
2028 is the halving year. Bitcoin Cash’s block reward is due to fall from 3.125 to 1.5625 BCH, and the run-up plus the early aftermath push the average toward $430, inside a range of roughly $304.20–$560.86. Halvings cut the rate of new supply; the price reaction historically lands over the following year rather than on the day itself.
| Month (2028) | Minimum | Average | Maximum |
|---|---|---|---|
| January | $304.20 | $345.38 | $386.57 |
| February | $316.92 | $360.77 | $404.62 |
| March | $329.57 | $376.15 | $422.74 |
| April | $342.14 | $391.54 | $440.93 |
| May | $354.65 | $406.92 | $459.20 |
| June | $367.08 | $422.31 | $477.53 |
| July | $377.51 | $435.45 | $493.40 |
| August | $385.93 | $446.36 | $506.79 |
| September | $394.31 | $457.27 | $520.24 |
| October | $402.64 | $468.18 | $533.73 |
| November | $410.91 | $479.09 | $547.27 |
| December | $419.14 | $490.00 | $560.86 |
Bitcoin Cash price prediction 2029
2029 holds the cycle peak in this outlook, averaging near $550 across a range of about $430.40–$677.47. In past four-year cycles the top has arrived roughly twelve to eighteen months after the halving, which places the high in this window before momentum cools.
| Month (2029) | Minimum | Average | Maximum |
|---|---|---|---|
| January | $431.13 | $505.38 | $579.64 |
| February | $443.05 | $520.77 | $598.48 |
| March | $454.91 | $536.15 | $617.40 |
| April | $466.69 | $551.54 | $636.39 |
| May | $478.40 | $566.92 | $655.45 |
| June | $490.03 | $582.31 | $674.58 |
| July | $489.81 | $583.64 | $677.47 |
| August | $477.81 | $570.91 | $664.01 |
| September | $465.87 | $558.18 | $650.50 |
| October | $453.99 | $545.45 | $636.92 |
| November | $442.16 | $532.73 | $623.29 |
| December | $430.40 | $520.00 | $609.60 |
Bitcoin Cash price prediction 2030
2030 is the cool-down after the peak: an average near $470 across roughly $352.00–$601.76. Five years out, the shape of the path matters more than any single month, so treat the table below as a trajectory rather than a set of dated prices.
| Month (2030) | Minimum | Average | Maximum |
|---|---|---|---|
| January | $422.85 | $512.31 | $601.76 |
| February | $415.34 | $504.62 | $593.89 |
| March | $407.86 | $496.92 | $585.99 |
| April | $400.42 | $489.23 | $578.04 |
| May | $393.01 | $481.54 | $570.07 |
| June | $385.64 | $473.85 | $562.05 |
| July | $379.21 | $467.27 | $555.34 |
| August | $373.72 | $461.82 | $549.92 |
| September | $368.25 | $456.36 | $544.48 |
| October | $362.81 | $450.91 | $539.01 |
| November | $357.39 | $445.45 | $533.52 |
| December | $352.00 | $440.00 | $528.00 |
Bitcoin Cash long-term price prediction: 2035, 2040–2050
Push the horizon past 2030 and precision collapses. No model can price three more halvings, a decade of regulation, and mining economics that nobody can see yet, so the figures below are a slope, not a promise, and the error bars widen every year out. On that basis the long-range path grinds higher without ever going vertical: an average near $620 in 2035, near $820 in 2040, and near $1,150 by 2050, which is where a four-figure BCH first shows up on PrimeXBT’s numbers.
| Year | Minimum | Average | Maximum |
|---|---|---|---|
| 2035 | $471.20 | $620.00 | $768.80 |
| 2040 | $574.00 | $820.00 | $1,066.00 |
| 2050 | $713.00 | $1,150.00 | $1,587.00 |
What analysts and models say (compared)
Forecasters agree on 2026 and split hard after it. Algorithmic models cluster around $225–$240 for the 2026 average, then fan out for the back half of the decade as each one weights the halving differently.
| Source | Method | Bitcoin Cash view |
|---|---|---|
| CoinCodex | Algorithmic | 2026 avg ~$238 (range ~$208–$288); 2029 avg ~$696; 2030 avg ~$483 |
| Changelly | Algorithmic | 2026 avg ~$227; 2028 avg ~$526; 2030 avg ~$545; 2050 avg ~$1,176 |
| Coinbase (price-prediction page) | Algorithmic | Multi-year model extending to 2030 and 2040 |
| Binance (price-prediction page) | Algorithmic | Rule-based projection, 5% annual growth assumption |
The disagreement is the useful part. The near-term models sit within a few dollars of each other, yet by 2029 the same tools separate by hundreds of dollars because a halving is easy to date and hard to price. Where reputable models diverge this far, averaging them into one tidy number would hide the uncertainty rather than resolve it, so they are shown side by side.
Track record of this forecast
This is the first published PrimeXBT price forecast for Bitcoin Cash. From the next monthly review onward, this section will hold the previous forecast against BCH’s actual price on the update date and account for any miss instead of quietly moving on.
Bitcoin Cash technical analysis
Bitcoin Cash sits between its two most-watched averages, and the gap between them tells the story. BCH trades near its 50-day simple moving average around $216 but far under its 200-day average near $386, a spread that marks a downtrend that has not yet turned. The RSI reads near 47, squarely neutral, with no oversold bounce or overbought stretch to lean on. The Fear & Greed Index sits at 25, extreme fear.
The support and resistance levels in play now: support near $207, then $204; resistance near $217, then $220 and $224, with the 200-day average around $386 standing as the real ceiling overhead. Reclaiming that long-term average is the cleanest evidence the multi-year downtrend has broken. For a primer on reading these signals, see PrimeXBT’s guide to crypto technical analysis.
Correlation with other assets
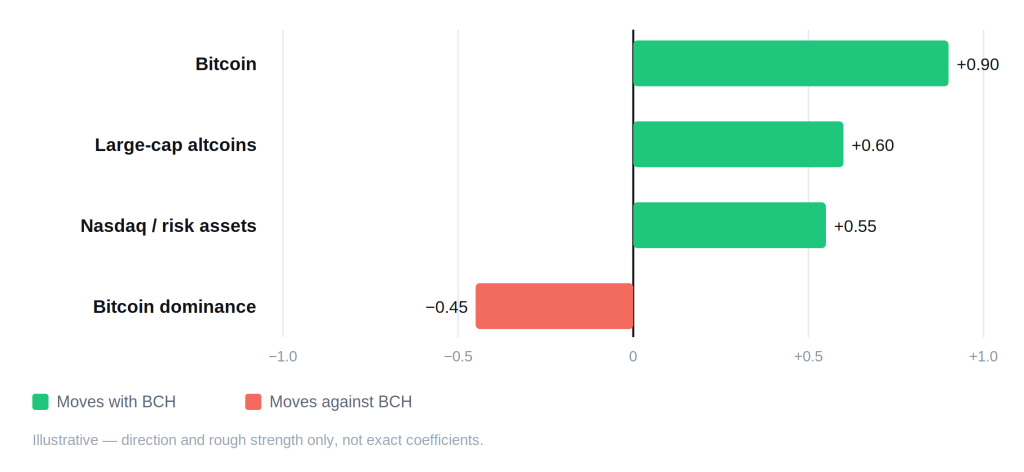
Almost everything about Bitcoin Cash’s price is downstream of Bitcoin. As a direct fork that inherited Bitcoin’s SHA-256 mining, its 21 million cap, and its four-year halving clock, BCH carries one of the tightest correlations to BTC of any major coin, tighter than most altcoins that answer to their own narratives. When Bitcoin rallies, BCH usually follows with more amplitude; when it falls, BCH tends to fall harder. Rising Bitcoin dominance is the standing headwind here, because a market that crowds into BTC itself leaves forks like BCH behind, and that is much of what the past year has looked like. Since institutions entered crypto, BCH has also swung with risk assets such as the Nasdaq, so Federal Reserve policy reaches its price through the same channel it reaches equities. What BCH does not track is the smart-contract and DeFi economy that drives Ethereum and its layer-2s, its story is a payments coin measured against Bitcoin, and these ties move with the market rather than holding at any fixed number.
Fundamental factors
Bitcoin Cash was born on August 1, 2017, when a faction of the Bitcoin community forked the chain over how to scale it. Their answer was bigger blocks, first 8MB and later 32MB against Bitcoin’s 1MB plus SegWit, so more transactions could settle directly on-chain for lower fees. That single design choice still defines the coin: BCH is Bitcoin’s big-block branch, built for cheap everyday payments rather than for programmable finance.
The monetary rules mirror Bitcoin almost exactly. BCH runs SHA-256 proof-of-work, caps supply at 21 million coins, and halves its block reward roughly every four years. Just over 20 million BCH already circulate, so more than 96% of the eventual supply exists today, and the last halving on April 4, 2024 cut the reward to 3.125 BCH. The chain has kept evolving on the payments theme: CashTokens arrived in a 2023 upgrade to add token issuance and light smart-contract features, while the network stayed focused on merchant use. Its sharpest scar is political, in November 2018 a governance fight split BCH again and spun off Bitcoin SV (BSV), a reminder that fork coins carry fork risk.
Upcoming catalysts
Only confirmed, dated events are listed. With BCH now moving alongside risk assets, macro policy is the clearest near-term driver, while the halving is the structural one further out.
| Date | Event | Potential impact |
|---|---|---|
| September 15–16, 2026 | FOMC meeting (with economic projections) | Bull if the Fed signals cuts; bear if it holds rates higher for longer |
| October 27–28, 2026 | FOMC meeting | Rate path steers risk appetite across crypto, BCH included |
| December 8–9, 2026 | FOMC meeting (with economic projections) | Year-end policy signal for 2027 positioning |
| 2028 (date not yet confirmed) | Next Bitcoin Cash halving | Block reward drops from 3.125 to 1.5625 BCH; tightens new supply |
FOMC dates follow the Federal Reserve’s published 2026 schedule. The halving is listed without a day because it triggers at a block height, not a calendar date, so any exact day this far out would be a guess rather than information.
Bull case vs bear case
Bull case:
- The 2028 halving cuts new BCH issuance, and the supply squeeze feeds into the following year’s move.
- The Fed shifts to rate cuts and capital rotates back toward risk assets, lifting Bitcoin and its forks together.
- Bitcoin dominance eases, letting money flow down the risk curve into coins like BCH.
- Steady merchant and payments use gives BCH a floor of real on-chain demand beneath the speculation.
Bear case:
- Capital stays parked in Bitcoin, and BCH keeps bleeding relative value as dominance climbs.
- Rates hold higher for longer, capping every high-beta corner of crypto.
- BCH stays below its 200-day average, with extreme-fear sentiment feeding more selling than buying.
- Buyers step back and the $207 support cracks, opening room toward the low $200s and below.
Invalidation levels. The bull case loses its footing if BCH closes convincingly below $204, the second support and the floor of the current base. The bear case breaks on a sustained move back above the 200-day average near $386, the same line the technical section flags as the real ceiling, roughly 80% above the early-August price and the clearest sign the multi-year downtrend has ended. The nearer trigger, $207, sits just under spot and marks the first line bulls must defend.
Historical performance
Bitcoin Cash launched straight into the 2017 mania and peaked at $4,358 within months, then spent the years since giving most of it back. The path down came in steps, the 2018 BSV split, the long 2018–2020 bear market, brief rallies inside each Bitcoin cycle that never reclaimed the old high. In early August 2026 it changes hands near $214, still well under its record and under its own 200-day average. The lesson in that chart is amplitude, not direction: BCH has always moved further than Bitcoin in both directions, and no past cycle obliges the next one to rhyme.
Is Bitcoin Cash a good investment in 2026?
It comes down to horizon and appetite for risk. PrimeXBT’s outlook has BCH basing through 2026 near a $235 average rather than trending, with the real upside tied to the 2028 halving and a broader Bitcoin recovery still ahead. The facts underneath are plain: BCH trades below its long-term average, sentiment sits at extreme fear, and its fortunes ride on Bitcoin more than on anything it controls itself. Whether that setup reads as a discounted entry or a value trap is the reader’s judgment to make. PrimeXBT’s comparison of Bitcoin versus Bitcoin Cash works through the trade-offs in detail.
How to trade Bitcoin Cash on PrimeXBT
On PrimeXBT you can take a position on Bitcoin Cash in either direction. CFDs on BCH can be traded long or short, so a falling market is as tradable as a rising one, and short selling lets you position for downside without holding the coin. Leverage magnifies gains and losses alike, so position sizing and a stop-loss carry weight on every trade. Trade on your own analysis and risk tolerance, and never stake more than you can afford to lose.
Trading involves risk.
How we build this forecast
This outlook is assembled by PrimeXBT’s analysts rather than copied from one price feed. We start from where BCH trades today, read it against its 50- and 200-day moving averages and the nearby support and resistance, weigh the fundamentals that actually move a fork coin, chiefly the halving schedule, supply, and its correlation with Bitcoin, then set all of it against the macro backdrop and the path of U.S. interest rates. The yearly ranges combine that technical read with the fundamental and macro picture through a single continuous monthly model; the long-range figures lean on trajectory over precision.
None of this is a guarantee. Crypto is volatile, the inputs shift, and one turn in Bitcoin can move BCH faster than any forecast expects. Treat every figure here as a considered estimate, not a promise, and note that we revisit and update the outlook monthly as the data changes.
Is there a future for Bitcoin Cash?
Whether or not there is a future is hard to tell. However, there are a lot of “purists” out there that believe that BCH is the true version of BTC, and many people believe that it will be a more useful form of money.
Where will Bitcoin Cash be in 5 years?
The predictions are all over the place, but in general, most pundits believe that the price will be higher over the next several years.
Will BCH reach $1000?
It could. It had previously reached a high near $1500. It is obvious to most that the price of Bitcoin will have to take off for BCH to reach that level again.
How high Bitcoin Cash can go?
This remains to be seen. It will all come down to the adoption of not only crypto, but BCH itself. As things stand right now, it has not caught on, but the same can be said for Bitcoin. Also, it is still early for crypto, so therefore there is a long way to go in order to see where we end up.
How much will Bitcoin Cash be worth in 2030?
The long-range view centers on an average near $470 for 2030, inside roughly $352.00–$601.76. Numbers this far out are low-confidence and hinge on the halving cycle and the wider crypto market.
Author



 Risk Disclaimer
The content provided here is for informational purposes only. It is not intended as personal investment advice and does not constitute a solicitation or invitation to engage in any financial transactions, investments, or related activities. Past performance is not a reliable indicator of future results.
The financial products offered by the Company are complex and come with a high risk of losing money rapidly due to leverage. These products may not be suitable for all investors. Before engaging, you should consider whether you understand how these leveraged products work and whether you can afford the high risk of losing your money.
The Company does not accept clients from the Restricted Jurisdictions as indicated in our website/ T&C. Some services or products may not be available in your jurisdiction.
The applicable legal entity and its respective products and services depend on the client’s country of residence and the entity with which the client has established a contractual relationship during registration.