We saw bullish momentum building into Tuesday’s close, followed by a notable gap up at the open of today’s session. The move came in response to comments from U.S. Treasury Secretary Scott Bessent, who stated that the ongoing trade tensions with China are unsustainable and that he anticipates a de-escalation in the near future.
President Donald Trump echoed the sentiment, suggesting that tariffs on Chinese imports could be substantially reduced, pointing toward a potential softening of the U.S. stance in the trade dispute.
Let’s jump into the charts and see what price action is telling us.
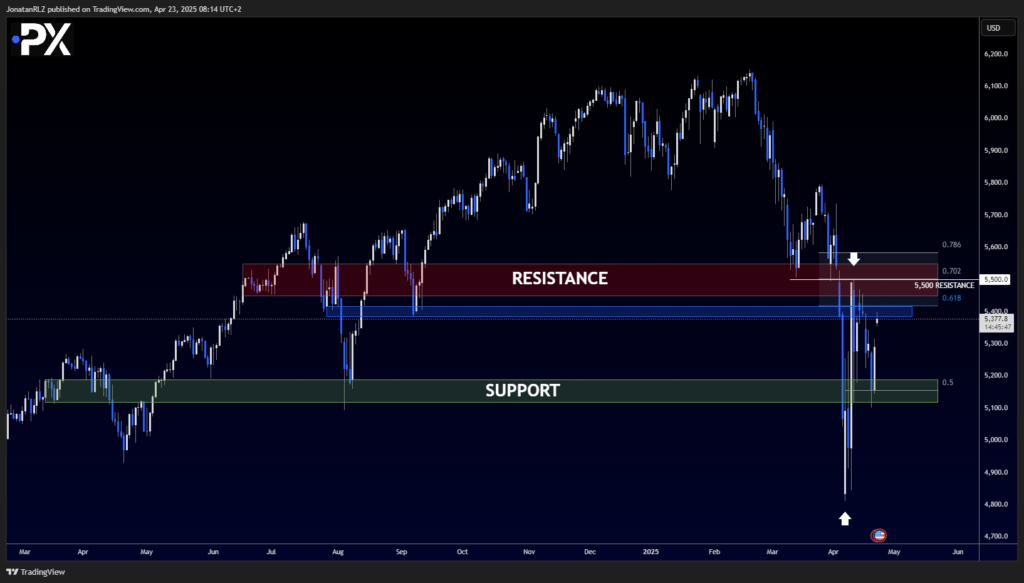
Daily Timeframe – Key Support Holding, Eyes on Blue Zone at 5,400
Starting with the daily timeframe, the S&P 500 has found support around the 5,150 area, which aligns with the high timeframe support zone mentioned in yesterday’s update. This area also holds confluence with the 50% Fibonacci retracement from the bullish Fib drawn from the most recent swing low to high.
While today’s bounce represents a notable reaction off a key level, the local downtrend that’s been developing in recent sessions may still be in play. For the market to fully reclaim a bullish tone, price would need to push through and hold above key resistance zones.
We’ve now added a new zone on the daily chart, highlighted in blue, sitting around 5,400. This level is in confluence with the 0.618 Fib retracement—a level that has historically acted as both resistance and support. Although it may not be the most dominant structural level based on frequency of touches, a reclaim of this zone could act as the first sign of strength returning to the S&P 500.
The 5,400 level may serve as an initial boundary that bulls must clear before we can talk about a deeper shift in high timeframe structure.
Let’s now move into the lower timeframes to explore how these levels align with range structures, and whether we can find additional confluence across timeframes.

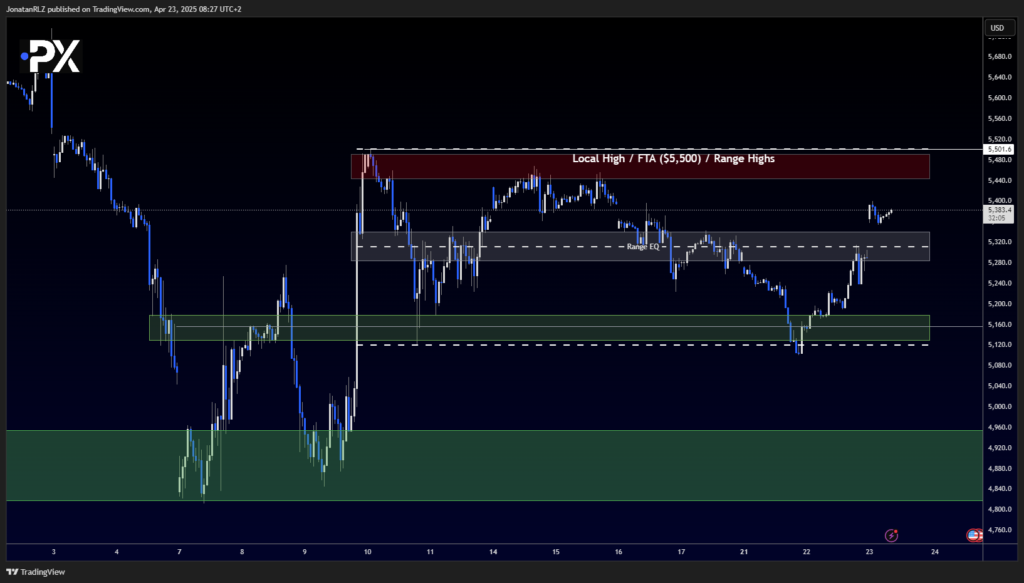
Intraday View – Reclaim of Range EQ, Momentum Builds Toward Resistance
On the lower timeframes, we can see that the recent move from the range lows has taken price directly to the range EQ—where the market closed yesterday. This was followed by a gap up at today’s open, which led to a reclaim of the range EQ, now acting as short-term support.
Since the open, we’ve seen sustained bullish price action with buyers stepping in, pushing price toward the upper boundary of the range and into the high timeframe resistance zones mentioned on the daily chart.
On the hourly, the S&P 500 remains technically range-bound, but the recent reclaim of structure and upward momentum has shifted short-term sentiment in favor of the bulls.
Let’s now zoom into the even lower timeframes to identify specific intraday levels for day traders and short-term participants—watching for possible reaction zones, breakout areas, or clean risk levels for managing risk.

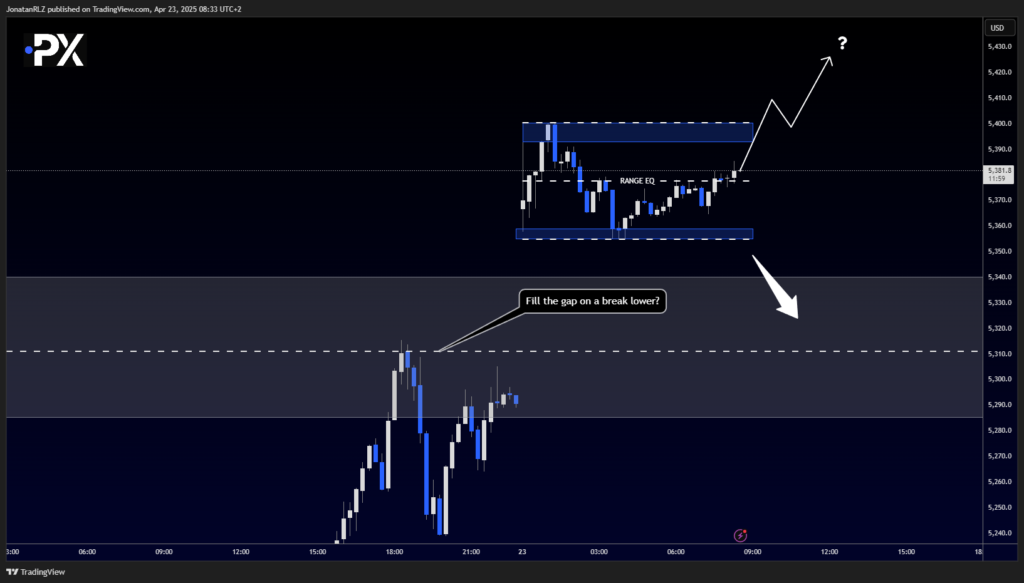
15-Minute Chart – Tight Range Developing With Clear Risk Levels
Looking at the 15-minute timeframe, we’re now seeing a potential short-term range forming, offering a clean structure for intraday traders and scalpers.
- Range Lows: ~5,355
- Range EQ: ~5,377
- Range Highs: ~5,400 — aligning nicely with the daily resistance zone mentioned earlier
If price breaks below the range lows at 5,355, it could open the door to a potential gap fill move. On the flip side, a break above 5,400 would signal renewed bullish continuation and may confirm a push through daily resistance.
For short-term traders, this range presents a clear structure to manage trades within—offering opportunities for mean reversion setups or breakout entries, depending on how price reacts around these levels.

The content provided here is for informational purposes only. It is not intended as personal investment advice and does not constitute a solicitation or invitation to engage in any financial transactions, investments, or related activities. Past performance is not a reliable indicator of future results.
The financial products offered by the Company are complex and come with a high risk of losing money rapidly due to leverage. These products may not be suitable for all investors. Before engaging, you should consider whether you understand how these leveraged products work and whether you can afford the high risk of losing your money.
The Company does not accept clients from the Restricted Jurisdictions as indicated in our website/ T&C. Some services or products may not be available in your jurisdiction.
The applicable legal entity and its respective products and services depend on the client’s country of residence and the entity with which the client has established a contractual relationship during registration.


