For this technical update, we are revisiting USDJPY for an intraday-focused overview. If you missed yesterday’s analysis, make sure to check it out first. We discussed the cyclical nature of the USDJPY market and why the current setup could mark the start of a new high time frame cycle.
Overnight, we saw major volatility in USDJPY following the news that President Trump’s global tariffs were deemed illegal and blocked by a US trade court. This development could potentially have significant implications, and we will most likely see Trump retaliate against this.
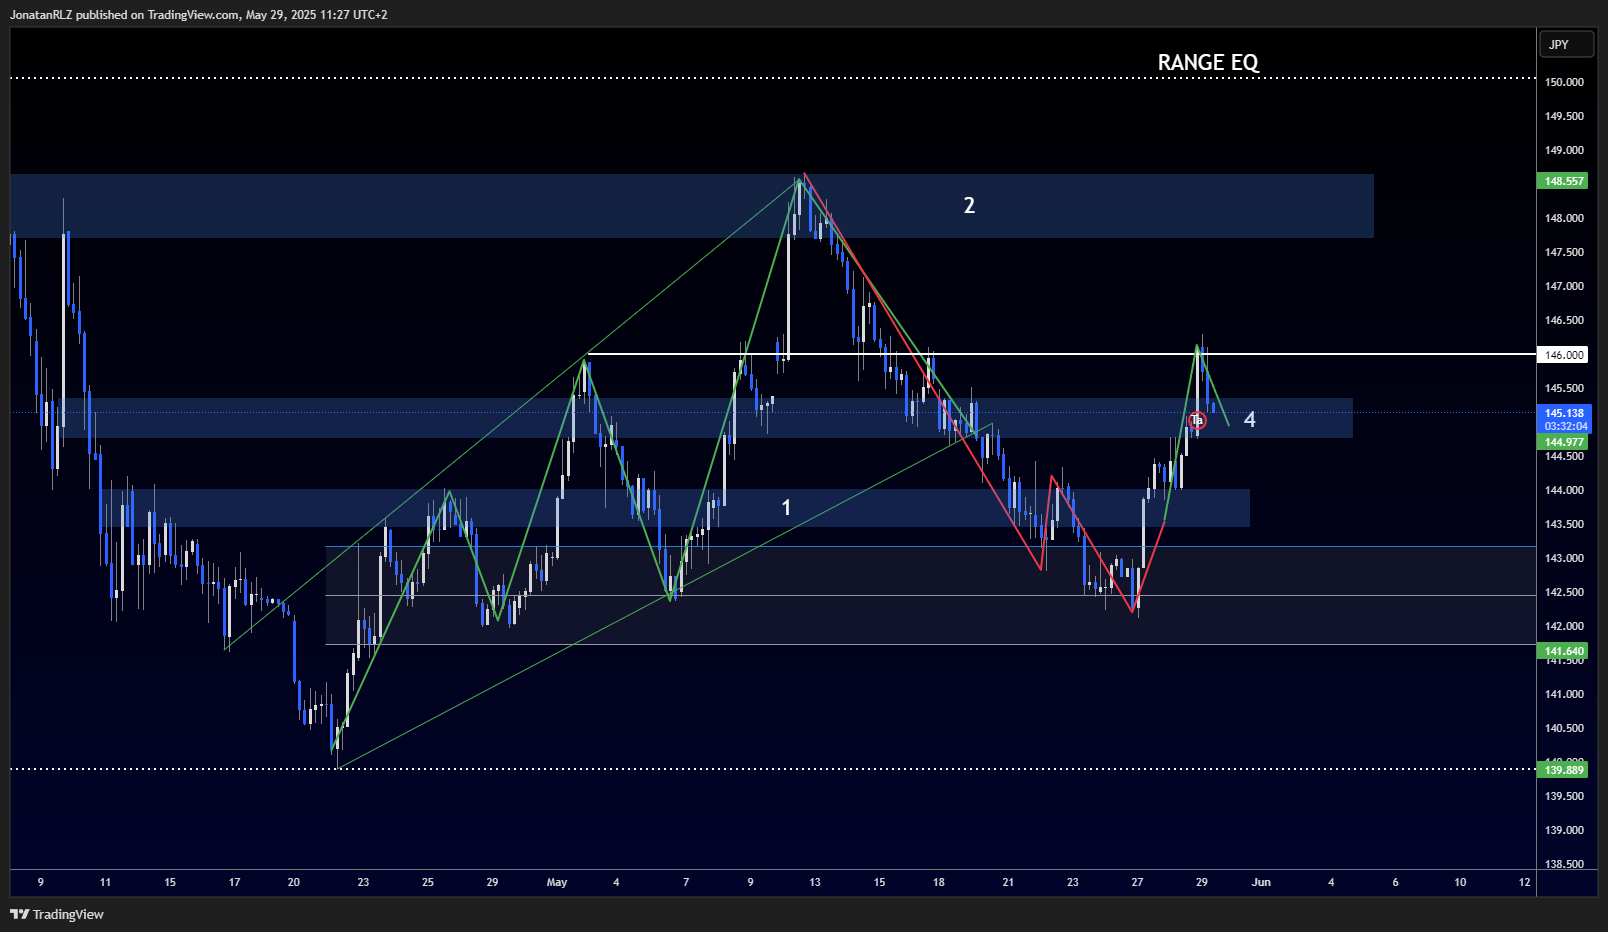
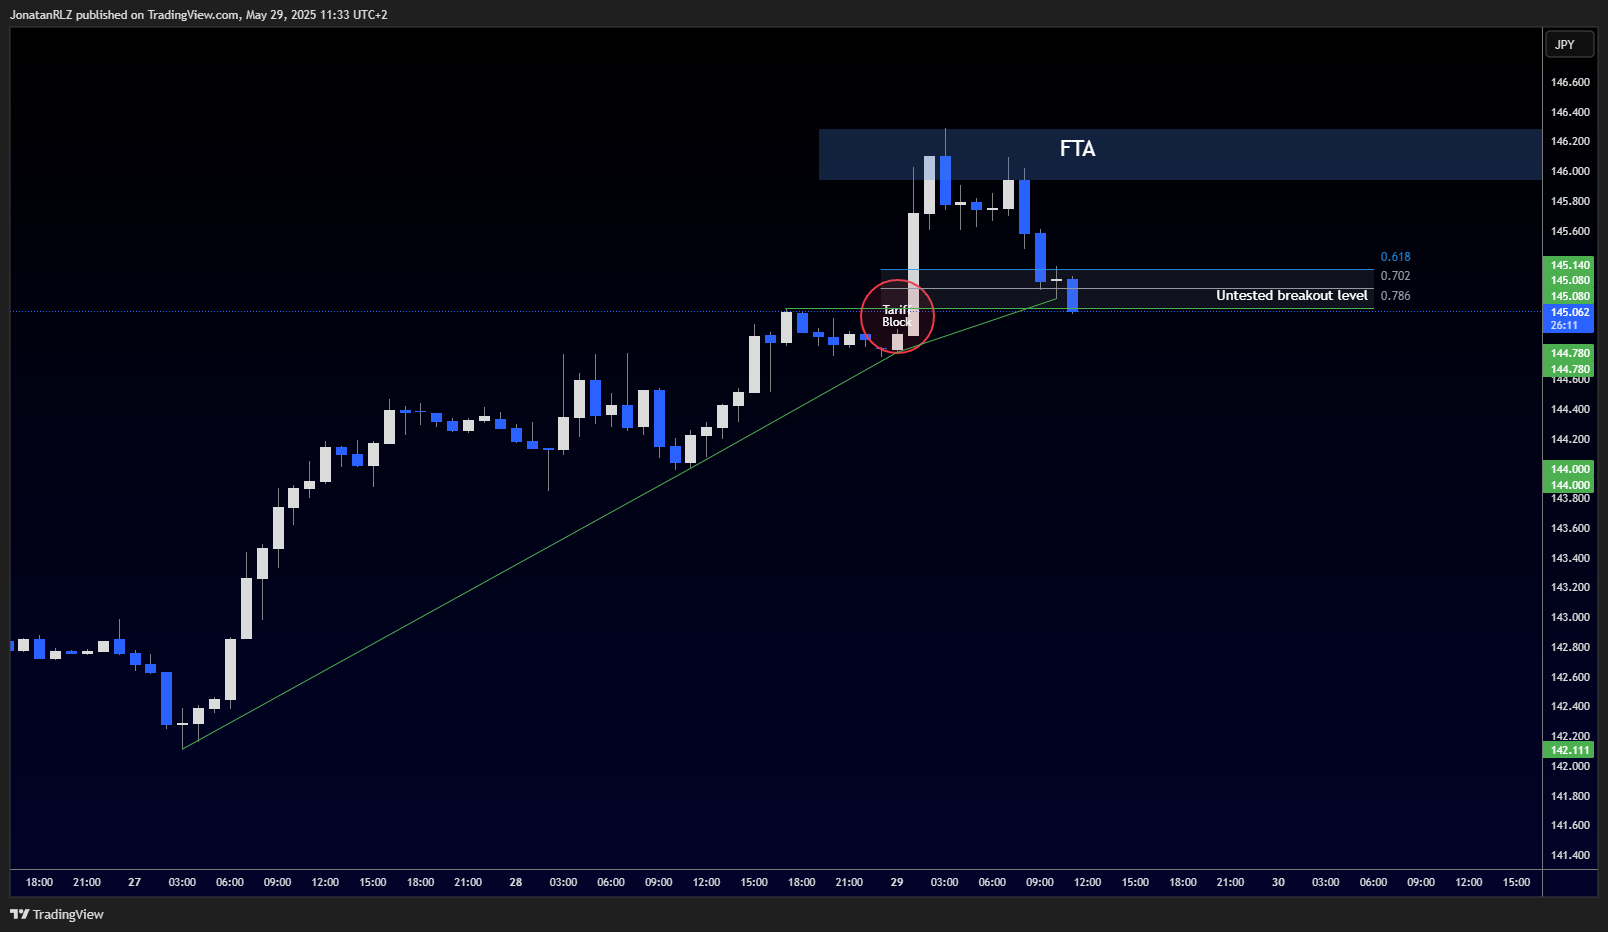
Following the tariff ruling, price surged through the first resistance zone at 145, marked with a red circle on the chart where the news hit the wires. That spike aligns well with the resistance area mentioned in yesterday’s article. The 145 level now also acts as an FTA, the first trouble area, for any short-term bullish momentum. If this level fails to hold as resistance, we could see a continuation toward the high time frame range EQ area, which is around 150.
The structure from here suggests that the W-shaped double bottom on the daily might be playing out. If this scenario continues to unfold, bulls will most likely be watching the 145 area closely for a bullish reaction. This level is not only psychological but also technically relevant, lining up with previous structure and the mid-point of the most recent impulse move.

Moving into the 1-hour chart, we are currently sitting inside the local reload zone, which is in confluence with the same 145 support area mentioned above. Momentum is currently to the downside, but this type of retrace is common after a strong news-driven rally. Notably, the level at 145.08 has not yet been tested following the breakout, and that level aligns with the 0.786 Fibonacci retracement and the origin of the breakout on the tariff news.
Trading involves risk.

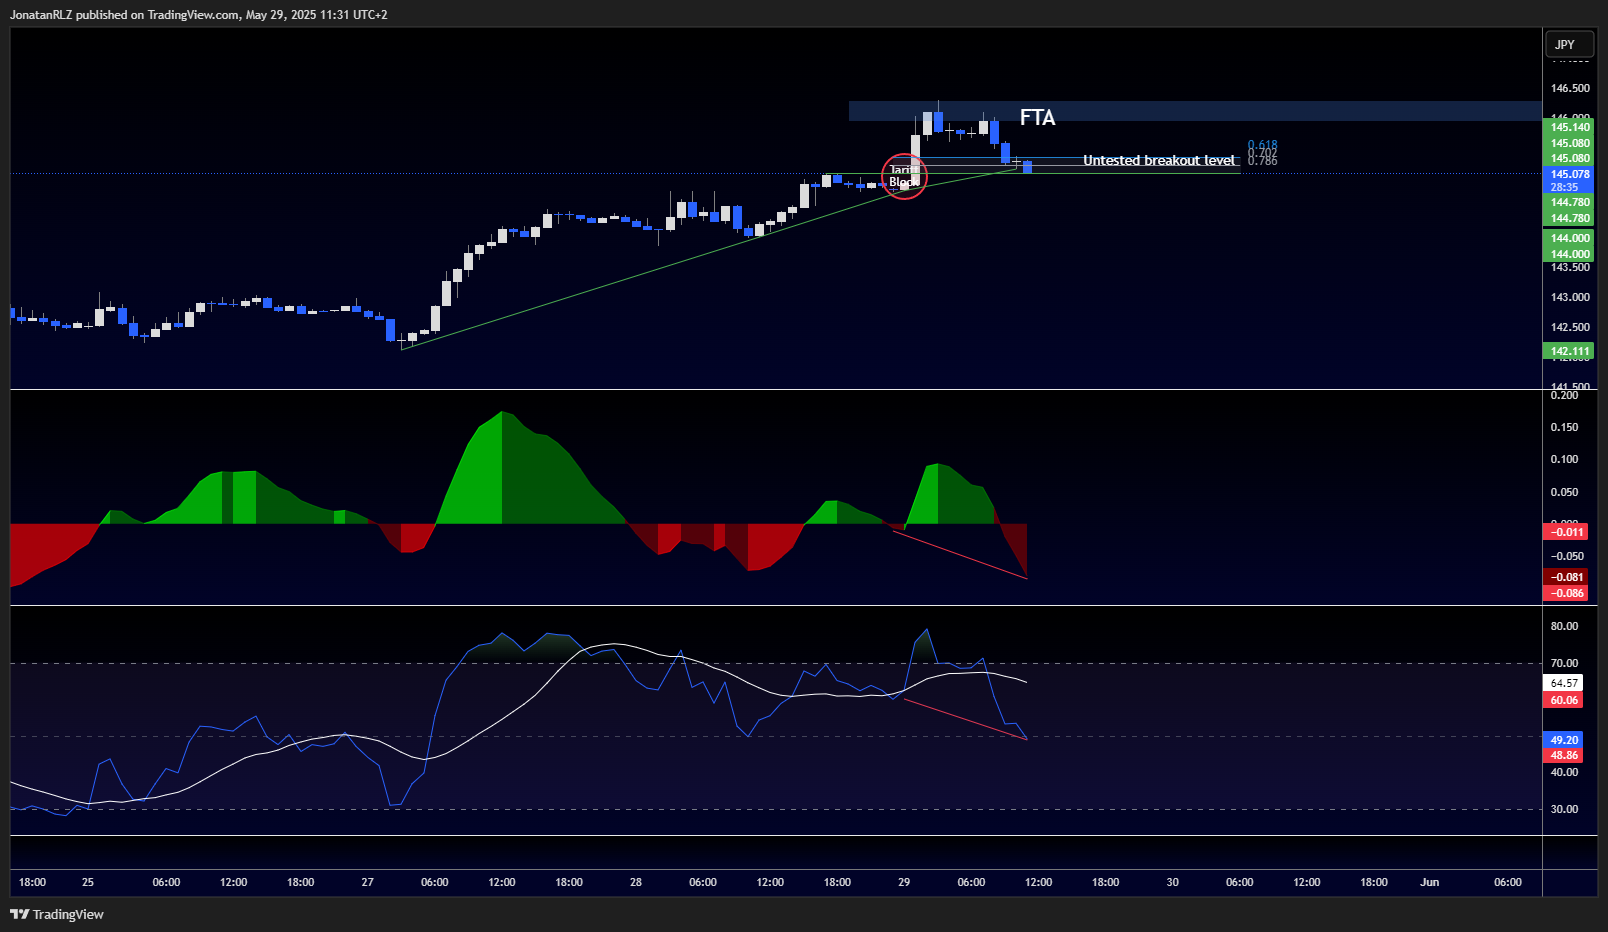
As we see the untested breakout level at 145.08 being tested right now, we turn to one final chart to evaluate the momentum indicators. Looking at the MACD histogram and the RSI, we notice a clear divergence forming.
The MACD histogram is showing a sequence of lower lows, and the RSI is also printing lower lows. However, price action is telling a different story, forming higher lows within the same period. This discrepancy between price and momentum indicators is a bearish divergence, suggesting a potential weakening of the current trend.
While this does not confirm an immediate reversal, it should be viewed as a warning sign for anyone looking to build positions in this area, especially considering the short-term overextension and the proximity to the high time frame resistance zone. Caution is warranted here until we see clear confirmation of renewed bullish strength.

In fast-moving markets, it is common to see price return to the origin of a move, especially when the move is driven by major headlines. A clean reaction off this zone would confirm strength and offer both day and swing traders reference points for risk management, particularly if the high time frame cycle structure we discussed yesterday continues to hold up.
Trading involves risk.
The content provided here is for informational purposes only. It is not intended as personal investment advice and does not constitute a solicitation or invitation to engage in any financial transactions, investments, or related activities. Past performance is not a reliable indicator of future results.
The financial products offered by the Company are complex and come with a high risk of losing money rapidly due to leverage. These products may not be suitable for all investors. Before engaging, you should consider whether you understand how these leveraged products work and whether you can afford the high risk of losing your money.
The Company does not accept clients from the Restricted Jurisdictions as indicated in our website/ T&C. Some services or products may not be available in your jurisdiction.
The applicable legal entity and its respective products and services depend on the client’s country of residence and the entity with which the client has established a contractual relationship during registration.


