5 min read
 The S&P 500 set a fresh record earlier this week and has fallen in both sessions since, as renewed tension around the Strait of Hormuz pushed oil higher and revived concerns about inflation and the Fed ahead of today’s July jobs report.
The 4-hour chart
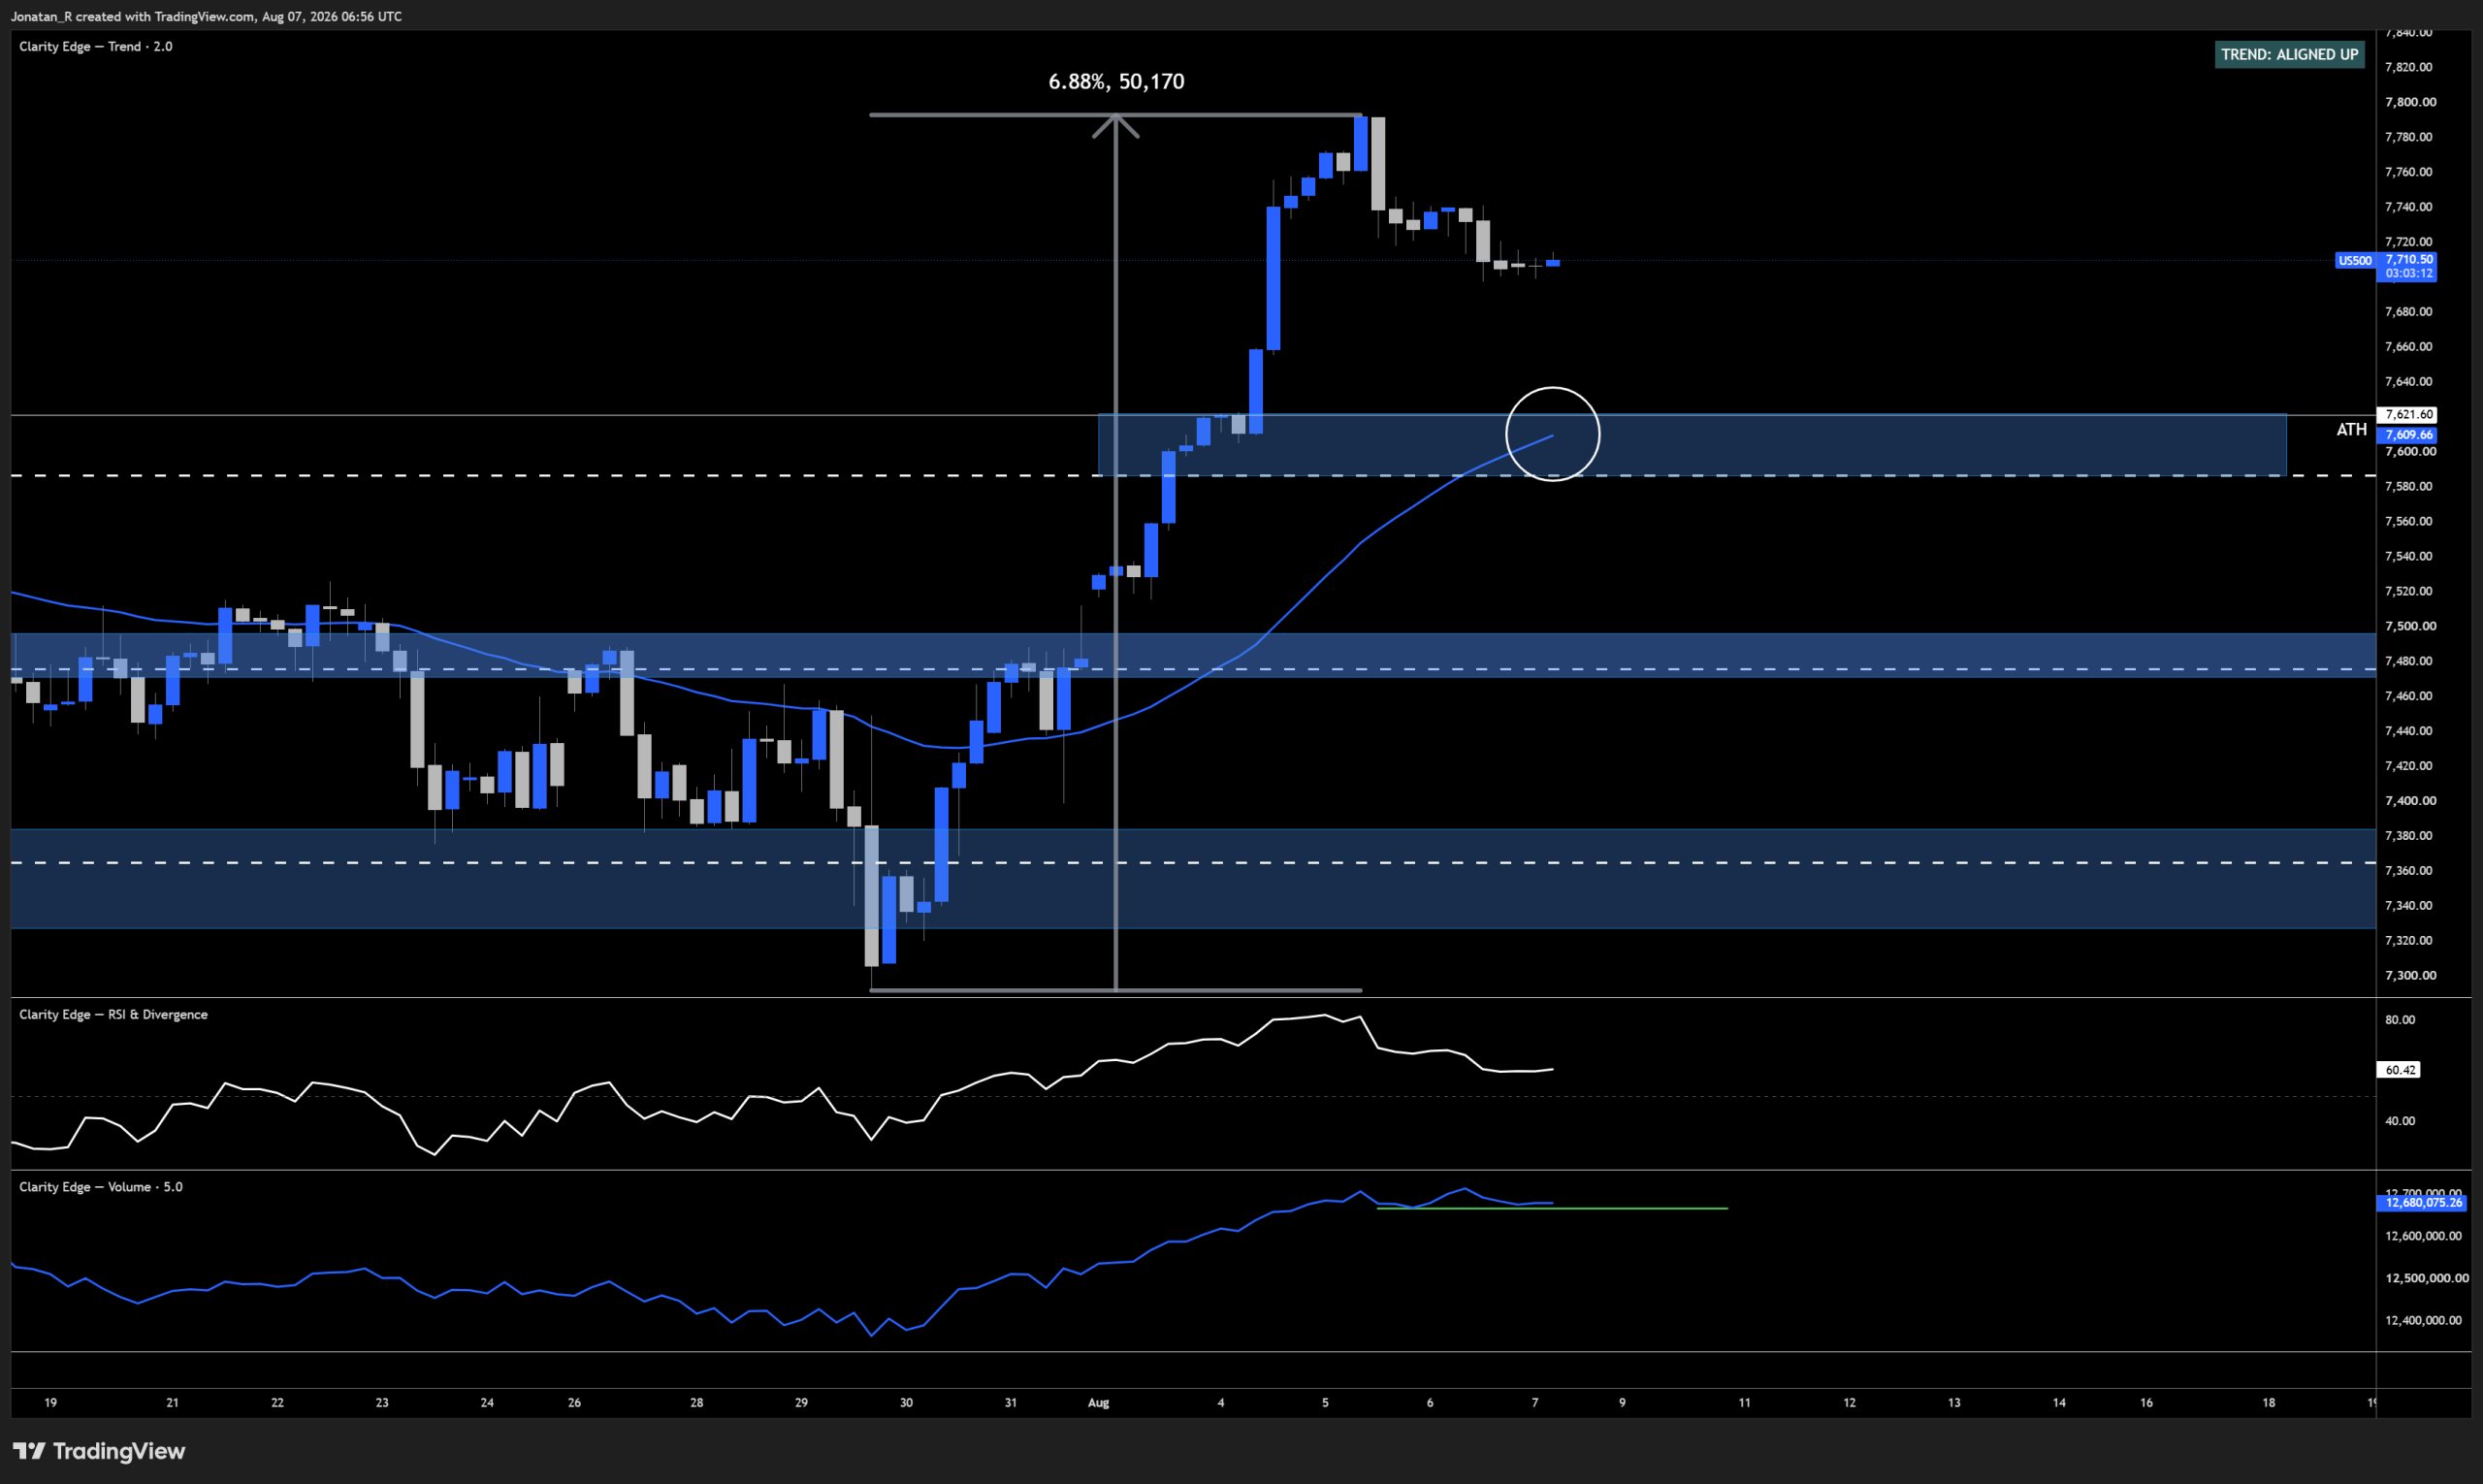
The S&P 500 4-hour chart, showing the rally from the late July lows and the 7,600 support zone beneath price.
As we noted in our previous coverage of the S&P 500, the index was stalling just beneath its record while the Middle East conflict escalated. That record has since been taken out. The S&P 500 has put in an impulsive rally of almost 7% from the lows a little over a week ago, and we are now seeing a potential local top forming.
Below price there is a support zone around 7,600, where the previous all-time high sits. This is also where the 4H 50 EMA is coming in, marked with the white circle on the chart, giving that area a second layer of confluence.
The accumulation and distribution line still looks relatively healthy and has not broken below its own low yet, so participation has not deteriorated in the way price alone might suggest. The RSI is approaching the 50 level.
The 1-hour chart
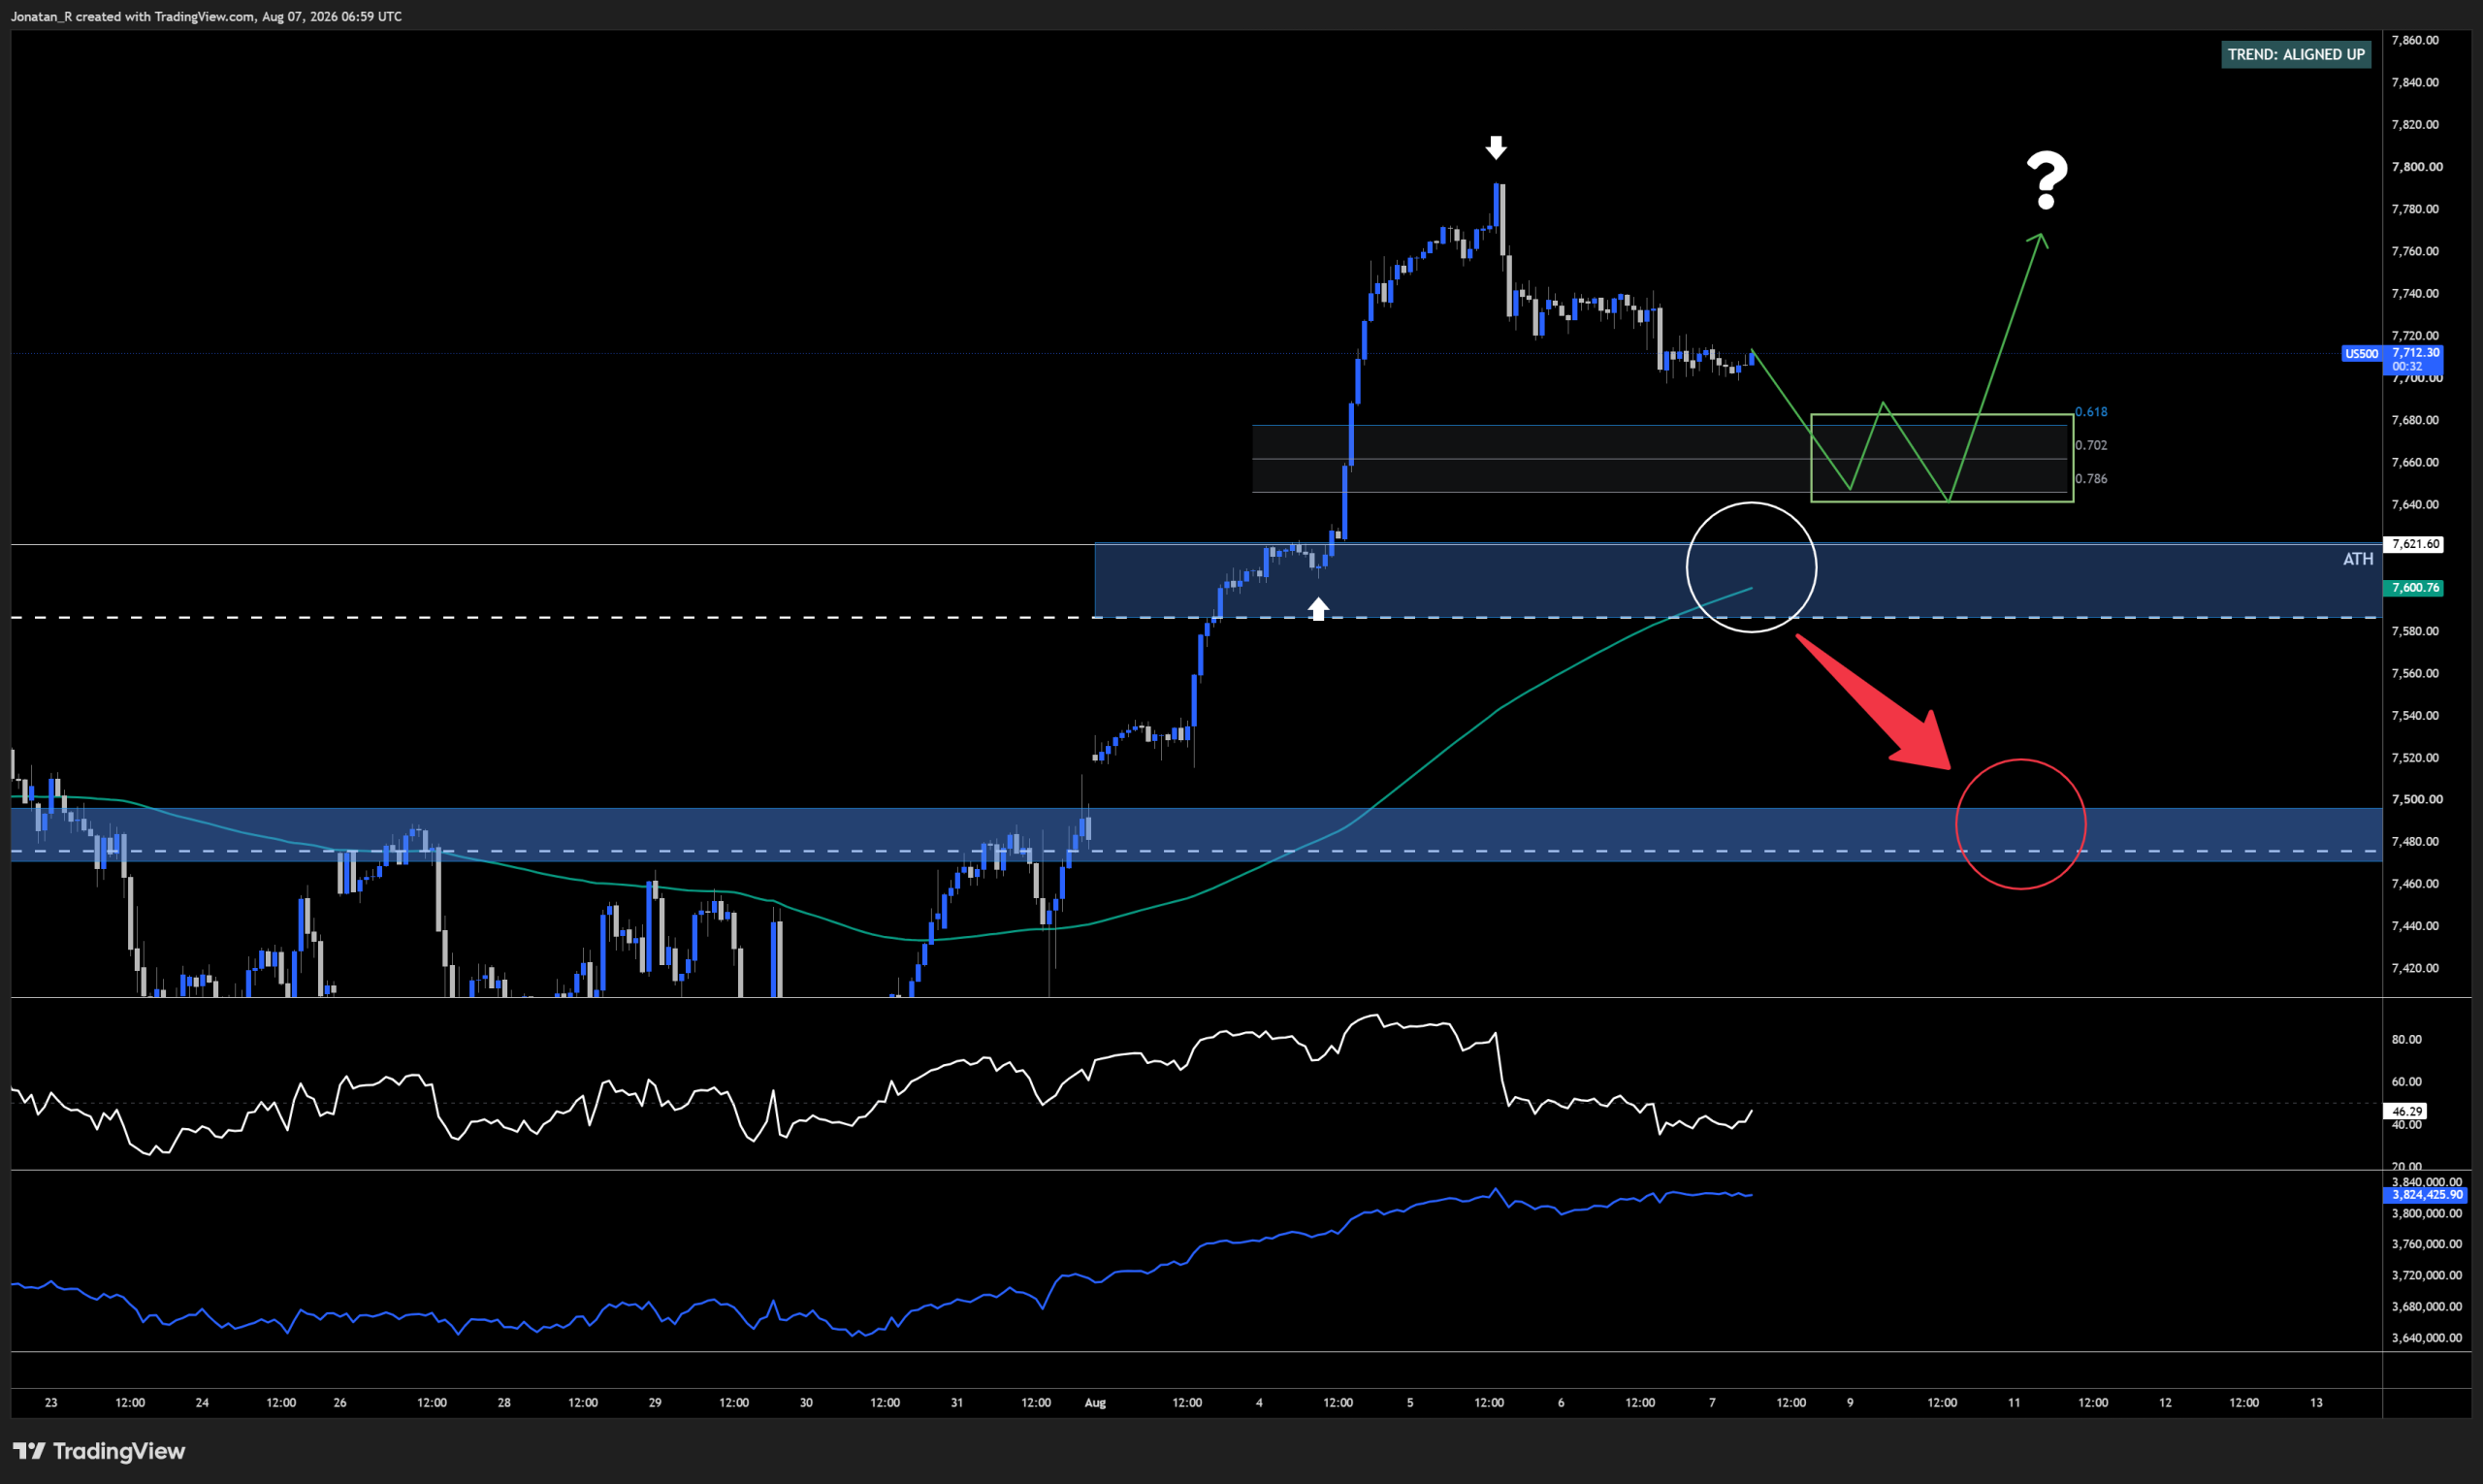
The S&P 500 1-hour chart, with the Fibonacci reload zone above the 7,600 support area and the 200 EMA.
Zooming in, the same 7,600 support zone is confluent with the 1H 200 EMA. Accumulation and distribution remains relatively strong here too, with no breakdown, but the RSI has dropped below its 50 level and could be entering a bearish range.
Drawing a Fibonacci retracement from the most recent breakout move, with the anchors marked by the white arrows on the chart, the reload zone comes in where the green box sits. In strong bullish momentum the most obvious support level can sometimes get front-run, which means buyers step in before price manages to reach it.
That leaves two levels of interest. The 7,660 area is the more bullish outcome, where buyers could step in early inside the reload zone. Below that, 7,600 is the level with the moving average confluence and the previous all-time high behind it. If price fails to hold the 7,600 support zone, we could potentially see a move down toward 7,500, which is the previous range.
Trade Now
Trading involves risk.
Author



 Risk Disclaimer
The content provided here is for informational purposes only. It is not intended as personal investment advice and does not constitute a solicitation or invitation to engage in any financial transactions, investments, or related activities. Past performance is not a reliable indicator of future results.
The financial products offered by the Company are complex and come with a high risk of losing money rapidly due to leverage. These products may not be suitable for all investors. Before engaging, you should consider whether you understand how these leveraged products work and whether you can afford the high risk of losing your money.
The Company does not accept clients from the Restricted Jurisdictions as indicated in our website/ T&C. Some services or products may not be available in your jurisdiction.
The applicable legal entity and its respective products and services depend on the client’s country of residence and the entity with which the client has established a contractual relationship during registration.