Welcome back to another daily market update on the S&P 500.
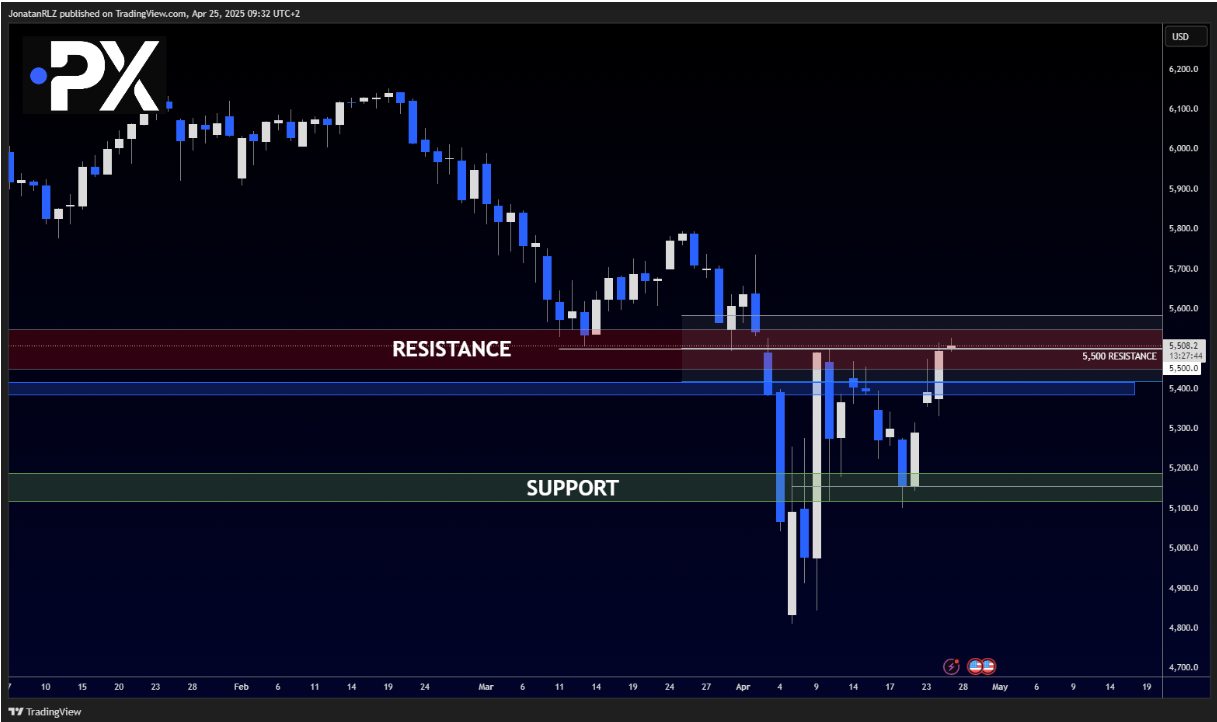
Looking at the daily chart, we saw a strong bullish candle close yesterday—just beneath the major 5,500 high timeframe resistance zone. Now, at the time of writing, the current daily candle is trading above 5,500, pushing us directly into that critical resistance area.
This could be an early sign that bulls are starting to gain control, but it’s far from a done deal. We’re now seeing sellers step in as well, creating a classic battle between bulls and bears right inside a key technical zone.
Who will come out on top? Time will tell.
For now, let’s dive into the lower timeframes to see if this week’s range-bound price action is finally giving way to something new—or if we’re still stuck inside familiar levels.

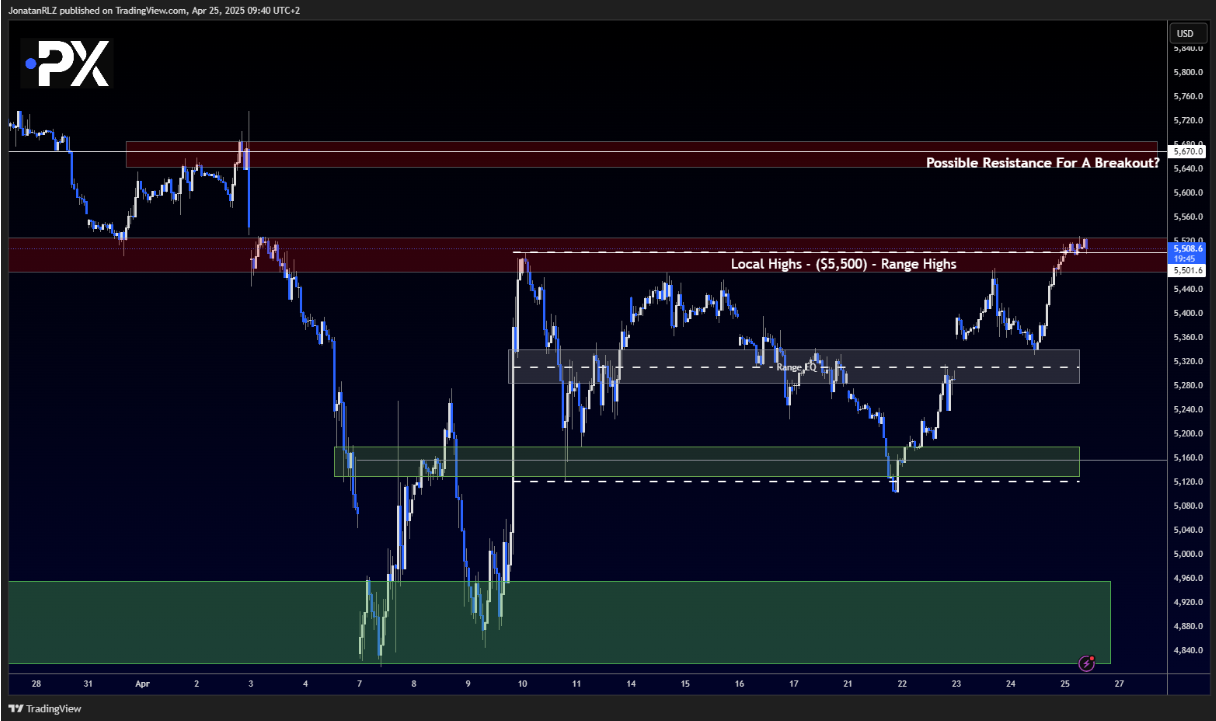
Zooming into the 1-hour chart, we can see that the S&P 500 has pushed above the local highs near 5,500, which previously marked the top of the range. However, frequent readers of these updates will note that the resistance zone has been adjusted, taking into account recent price behavior that aligns with historical price action around this level.
So even though price is currently above the previous range highs, this may still be interpreted as a retest of resistance rather than a confirmed breakout. The red zone remains a key high timeframe resistance area, and until we get clear acceptance and sustained price action above it, we’ll treat this as a potential false breakout.
If bulls are able to break through this zone convincingly, it could open the door for a move toward the next local resistance area at around 5,670. Such a move would also support the case for a true breakout on the higher timeframes.
But for now, resistance is still acting as resistance, and without a clean break, this zone is likely to continue capping price.
If we roll back below this red zone, we would once again consider the market range-bound, with the range EQ around 5,340 acting as probable support.

Wrapping up this report, we want to take a quick look at the weekly timeframe to put the current move in broader context.
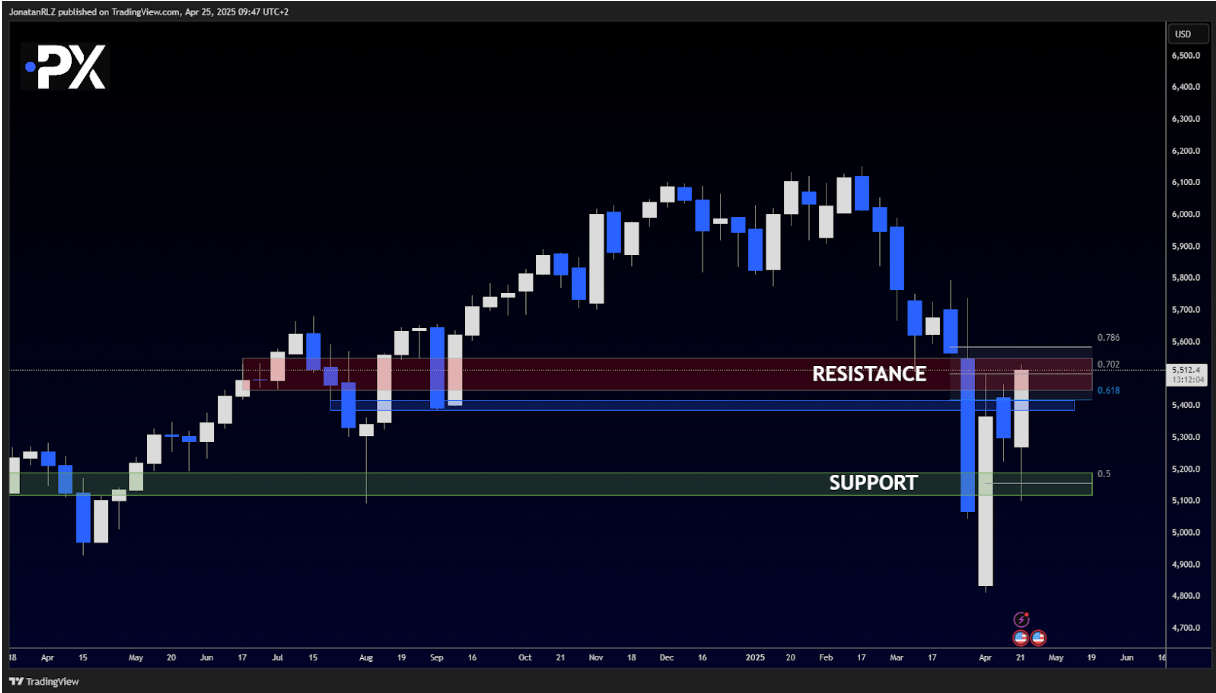
At the time of writing, there are still over 13 hours remaining before the weekly candle closes, so it may be premature to make firm conclusions. However, it’s worth noting the strength in this developing weekly candle.
Currently, we are printing a strong bullish engulfing candle—a sign of momentum and potential reversal. If this candle closes near its current levels and is accompanied by a confirmed breakout above the high timeframe resistance zone, it could represent a significant shift in the broader trend structure.
We’ll continue monitoring this into the weekly close and provide a full breakdown in Monday’s update.
Until then, have a great weekend, and as always—manage your risk, stay patient, and trade with clarity.

The content provided here is for informational purposes only. It is not intended as personal investment advice and does not constitute a solicitation or invitation to engage in any financial transactions, investments, or related activities. Past performance is not a reliable indicator of future results.
The financial products offered by the Company are complex and come with a high risk of losing money rapidly due to leverage. These products may not be suitable for all investors. Before engaging, you should consider whether you understand how these leveraged products work and whether you can afford the high risk of losing your money.
The Company does not accept clients from the Restricted Jurisdictions as indicated in our website/ T&C. Some services or products may not be available in your jurisdiction.
The applicable legal entity and its respective products and services depend on the client’s country of residence and the entity with which the client has established a contractual relationship during registration.


