Welcome back to another daily technical update on Gold.
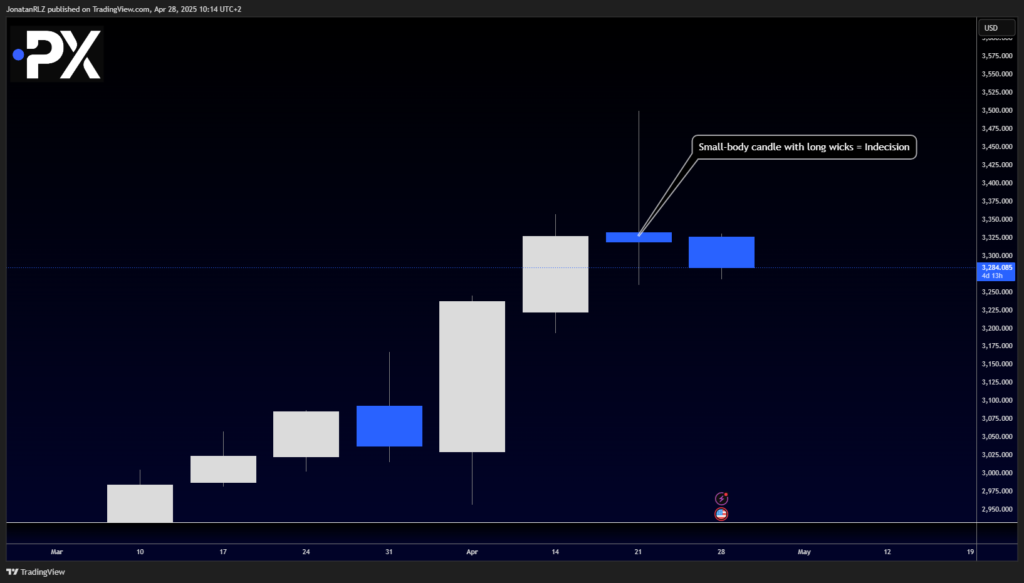
Starting with the weekly chart, we can see that last week’s candle closed as a classic indecision candle, characterized by a small body and long shadows both to the upside and the downside.
This candle could be categorized as a spinning top, although some traders might argue that a more “textbook” spinning top would have shadows that are even more symmetrical in length.
Still, there are no strict rules, and this fits well within the broader definition of indecision at key levels.
If the lower shadow were much smaller, the candle could also have been interpreted as a shooting star—a more traditionally bearish reversal signal.
The fact that we are now starting to see bearish price action developing after the close of this candle could add weight to the idea that this indecisive structure may be leading into a potential top formation.
If you remember from our previous updates, we’ve been tracking a head and shoulders pattern on the lower timeframes that could be building out as part of this reversal process.
Let’s now zoom into the lower timeframes to take a closer look at how that potential pattern is developing.

4H Chart – Head and Shoulders Structure Testing Key Support
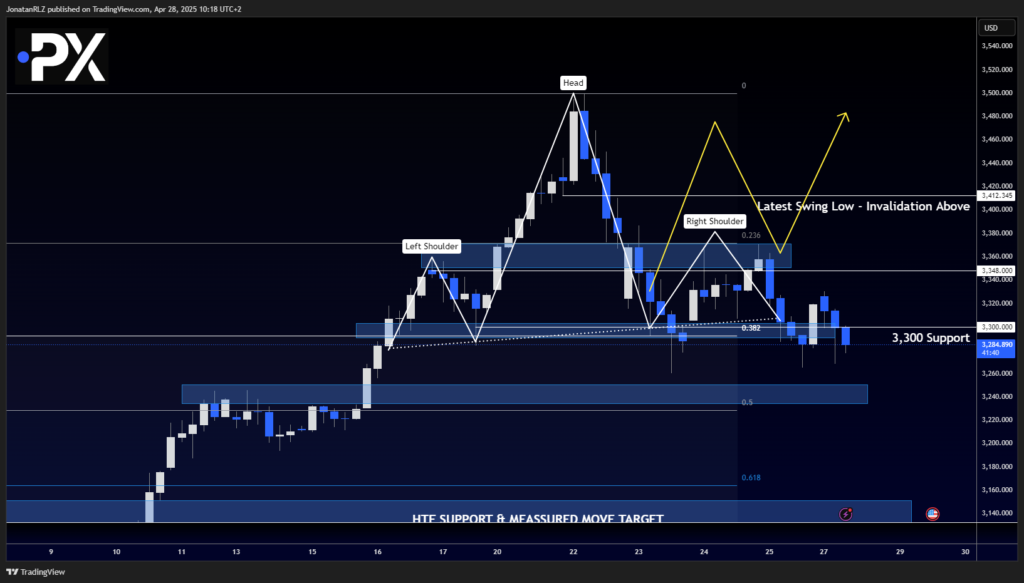
Switching back to the 4-hour chart, we continue to monitor the potential head and shoulders pattern that we’ve been tracking throughout last week.
The rejection off the 0.236 Fibonacci retracement level appears to have formed the right shoulder of this developing pattern.
Additionally, we can now observe a local lower high, adding further evidence that bearish momentum is building—at least from a local perspective.
Even though this head and shoulders setup isn’t perfectly symmetrical or textbook, the core principles still apply:
- We have a sequence of lower highs
- Price is retesting a key support zone
- The overall trend behavior shows a shift from bullish control to increasing bearish pressure .
Currently, the $3,300 area is acting as immediate support once again. If price decisively breaks below this level, the next downside targets would be:
- – A previous support zone
- – The measured move target of the head and shoulders pattern
For today, the critical levels to monitor are:
- Support: $3,300
- Resistance: ~$3,350 (upper boundary of the developing range)
How price behaves between these levels will likely set the tone for gold’s next major move.

The content provided here is for informational purposes only. It is not intended as personal investment advice and does not constitute a solicitation or invitation to engage in any financial transactions, investments, or related activities. Past performance is not a reliable indicator of future results.
The financial products offered by the Company are complex and come with a high risk of losing money rapidly due to leverage. These products may not be suitable for all investors. Before engaging, you should consider whether you understand how these leveraged products work and whether you can afford the high risk of losing your money.
The Company does not accept clients from the Restricted Jurisdictions as indicated in our website/ T&C. Some services or products may not be available in your jurisdiction.
The applicable legal entity and its respective products and services depend on the client’s country of residence and the entity with which the client has established a contractual relationship during registration.


