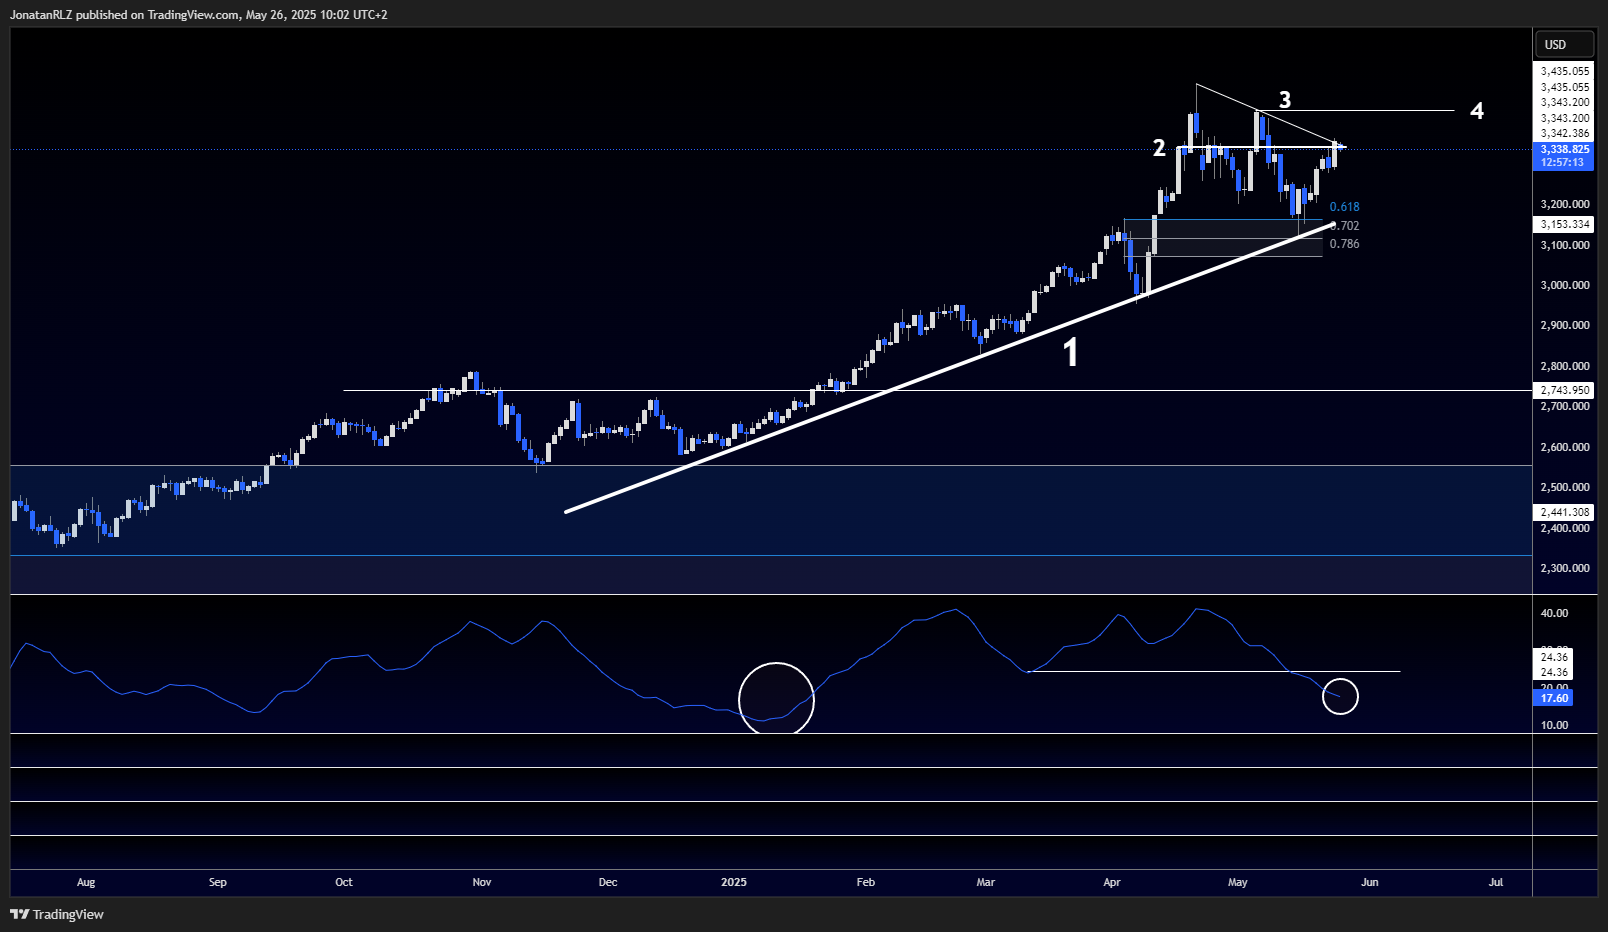
One of the most important structural elements on the chart right now is the ascending trendline marked with the number 1. This trendline has been in play since the end of last year, meaning this primary trend has been active for over 150 days. The previous higher low formed around this trendline also coincided with a key high time frame support zone, which overlaps with the reload zone, the area between the 0.618 and 0.786 Fibonacci levels. Historically, this is an area where price often finds support or resistance.
Despite the strength of the broader uptrend, the current local structure is in a downtrend, forming a descending trendline marked as number 3. Readers familiar with trend theory will know that the primary trend is marked by the longer-term ascending trendline, while the secondary trend is marked by this recent local downtrend. A shift in the primary trend is always preceded by a break or shift in the secondary trend. Therefore, the current price action is crucial in determining whether we are seeing a potential reversal or just a corrective phase within a larger uptrend.
We are now trading into a resistance area, marked as number 2, which is also confluent with the descending trendline (number 3). For gold to regain bullish momentum and signal a potential shift in structure, this is the level that needs to be reclaimed. However, a true structural break of the secondary downtrend would only be confirmed with a move above the horizontal resistance marked with the number 4, sitting around the 3,430 level.
Looking at the ADX below, the blue line at the bottom of the chart, we can see that it is currently sitting below 20, which is a level we have not seen since before the breakout that started this entire trend back in January. A falling ADX indicates weakening trend strength. However, this doesn’t necessarily mean the trend has ended. Often, we see trends pause and consolidate, allowing the ADX to reset before the next major move. Whether this current structure is a distribution range before a breakdown, or a re-accumulation phase before another leg to the upside, remains to be seen.

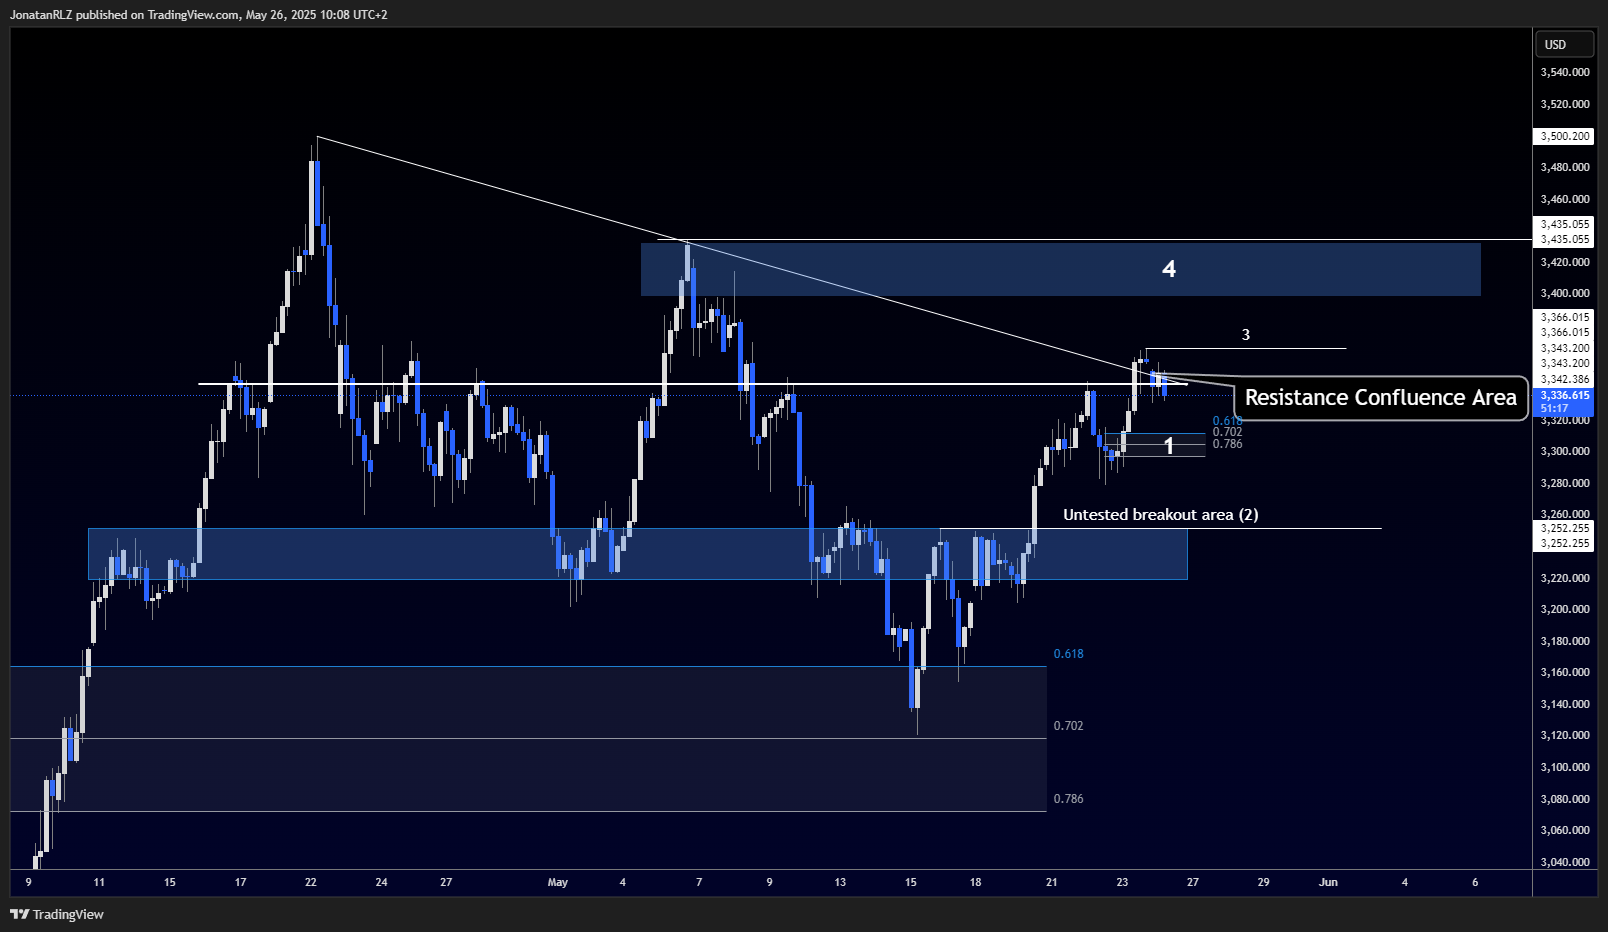
Dropping down to the 4-hour chart, there are several important areas to monitor.
First, the current region being tested, as previously mentioned, is a complex resistance zone. We have both a horizontal resistance level and the descending trendline from the daily chart converging here. This means that for gold to break higher, buyers will need to show significant conviction to push through.
Below price, we have the local reload zone marked as number 1. This zone could act as support if gold retraces from current levels. If price finds support here, it could provide an area for traders to manage risk for a potential continuation higher.
Further below, we have a key level marked with number 2, labelled as “untested breakout area”. This level represents the neckline of an inverted head and shoulders pattern that formed during the bounce off the high time frame reload zone. It has yet to be retested, making it a potentially strong support if tested in the future.
To the upside, the local highs marked with number 3 are the first major resistance to watch. A clean breakout above this level, ideally supported by volume, would open the door for a move toward the high time frame resistance marked as number 4, which would be the next significant barrier for gold.
These are the key levels to monitor on gold throughout the day and potentially throughout the week. They provide a useful roadmap for both trend-following and mean-reverting traders to manage risk effectively.

Trading involves risk.
The content provided here is for informational purposes only. It is not intended as personal investment advice and does not constitute a solicitation or invitation to engage in any financial transactions, investments, or related activities. Past performance is not a reliable indicator of future results.
The financial products offered by the Company are complex and come with a high risk of losing money rapidly due to leverage. These products may not be suitable for all investors. Before engaging, you should consider whether you understand how these leveraged products work and whether you can afford the high risk of losing your money.
The Company does not accept clients from the Restricted Jurisdictions as indicated in our website/ T&C. Some services or products may not be available in your jurisdiction.
The applicable legal entity and its respective products and services depend on the client’s country of residence and the entity with which the client has established a contractual relationship during registration.


