7 min read
 Key takeaways
- The Fed held at 3.50% to 3.75% on a 9 to 3 vote, with all three dissenters pushing for a hike rather than a cut, and the press conference offered no forward guidance in either direction.
- Long-term real yields have pushed to their highest at auction in almost 18 years while inflation expectations have stayed anchored, historically one of the more reliable headwinds for an asset that pays no yield.
- Bollinger BandWidth on the daily chart sits at historical lows at 5.12, with the squeeze on for 21 bars, pointing to a volatility expansion building without indicating a direction.
- A break above 4,200 could potentially open the 4,300 to 4,400 area, while a break below 4,000 could potentially expose 3,700.
The Fed held, and told markets to stop watching it
The Federal Open Market Committee left its target range unchanged at 3.50% to 3.75% on a 9 to 3 vote, the fifth straight meeting without a change, and all three dissenters wanted a quarter point hike rather than a cut. The decision was widely expected. The press conference was not, and that’s where the week’s positioning came apart. Chair Kevin Warsh refused to call the hold a pause, repeated that there’s no soft or implicit inflation target and that the goal remains 2%, and said five years of above-target inflation can’t be undone in nine weeks. He offered no forward guidance and deflected every attempt to draw any out of him, describing market participants as learning to “play the ball, not the referee”. For traders, that means the largest scheduled event of the month passed without handing anyone a direction.
The move landed in the long end, and real yields are doing the work
The 30-year Treasury yield jumped more than 10 basis points on the decision and touched its highest level since 2007, while the 2-year fell, steepening the curve sharply. What matters for gold is the composition of that move. A 10-year inflation-protected auction last week cleared at a real yield of 2.438%, the highest at auction in almost 18 years, while the implied breakeven rate came in lower than recent auctions of the same maturity. Long-term inflation expectations have stayed inside their multi-year range even through the war and the disruption to oil supply. Real yields rising while inflation expectations stay anchored is historically one of the more reliable headwinds for an asset that pays no yield, and it’s the clearest reason gold could only manage a gain of roughly 1% on a day the dollar eased.
The opposing force is escalating
The conflict has widened again. Iran’s Revolutionary Guard fired ballistic missiles at US military targets in Jordan, which were intercepted, and US and Saudi aircraft struck logistics and weapons sites across eastern Iraq in response to a wave of drone attacks on US forces and Saudi energy infrastructure. US forces then completed what was described as a heavy wave of strikes against Iran, and Tehran is reported to have rejected a proposal for joint regional management of the Strait of Hormuz. Crude rose more than 7% on Wednesday. Safe-haven demand and higher energy costs pull gold one way while real yields pull it the other, which is why the metal has spent the month going nowhere in particular. June PCE, the inflation measure the Committee watches most closely, lands later today, alongside the first estimate of second quarter growth.
Gold (XAU/USD) daily chart
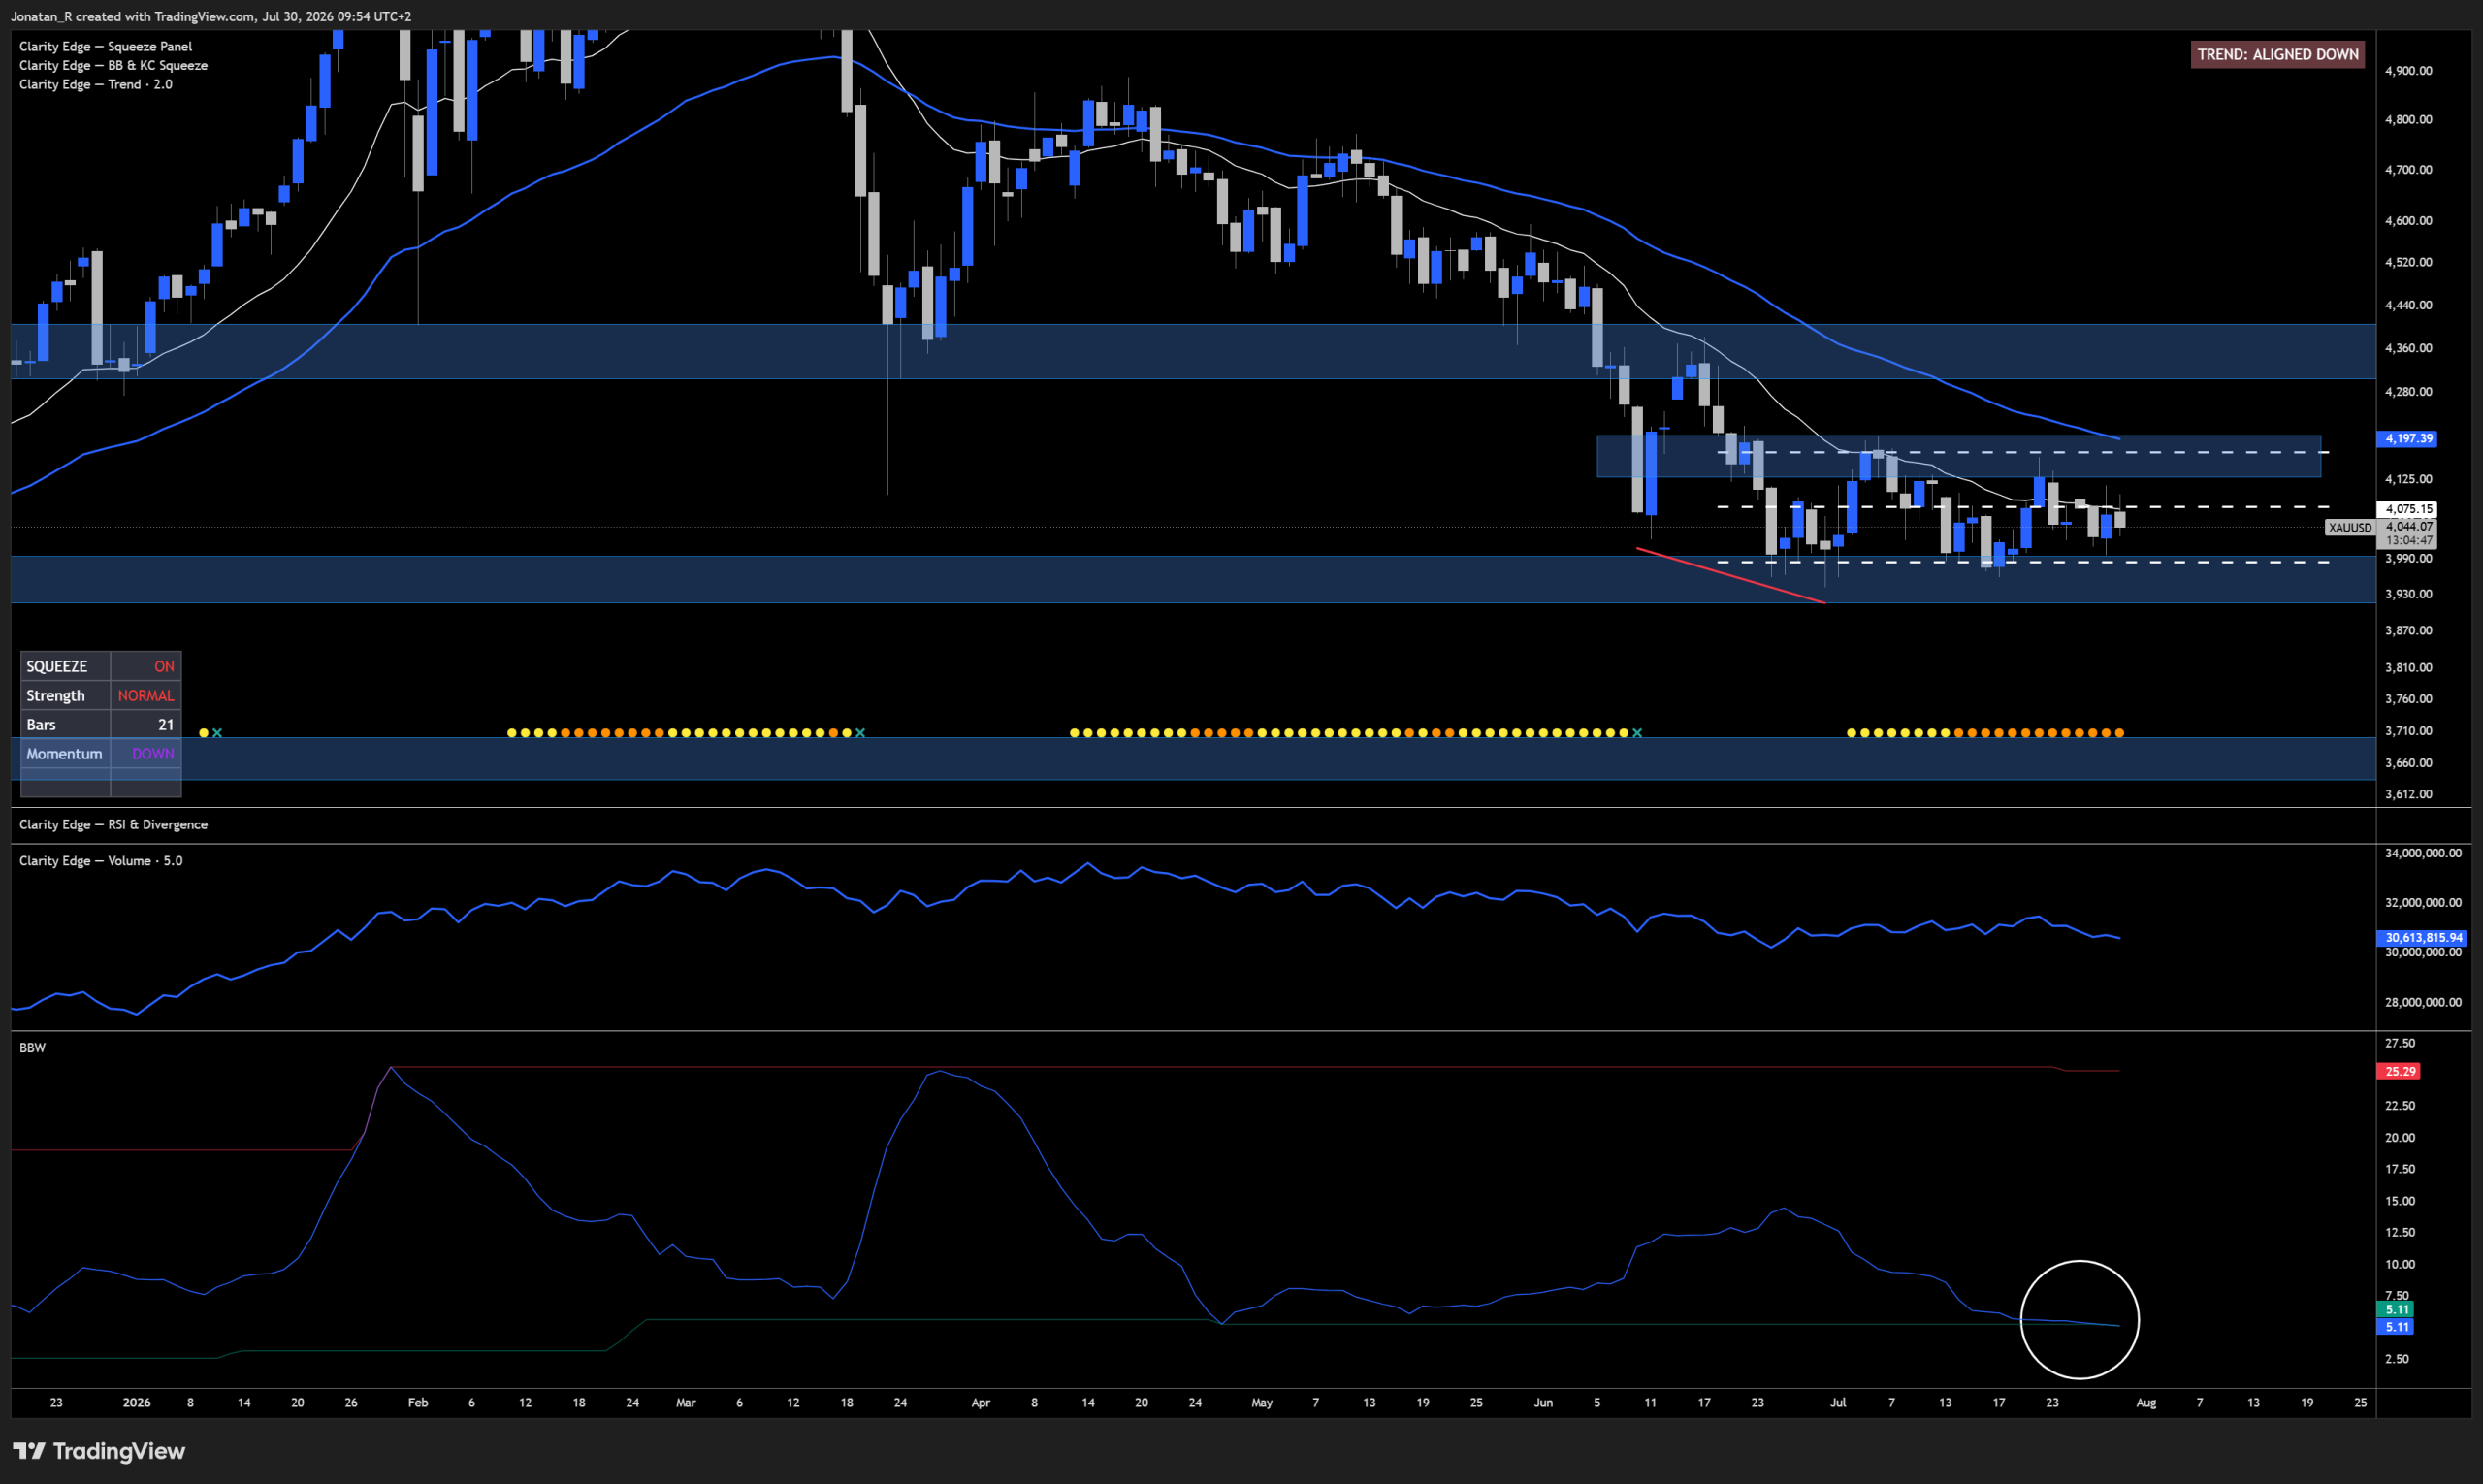
Gold’s daily chart with Bollinger BandWidth at historical lows and the squeeze reading on for 21 bars.
Since our previous coverage of gold, price has stayed inside the same compressed range it’s held since June. What stands out now is the Bollinger BandWidth indicator at the very bottom of the chart, sitting at historical lows at 5.12, which tells us the market has been consolidating. The squeeze has been on for 21 bars, momentum reads down, and the trend filter remains aligned down.
One fundamental idea within technical analysis and the markets is that volatility is extreme seeking. After low volatility comes high volatility, and vice versa. The question is when we get a volatility expansion. That tells us nothing about the direction of the move.
A break above 4,200 could potentially take price up to the 4,300 to 4,400 area. A volatility expansion to the downside could potentially take price down to that 3,700 area. For swing traders and investors, a resolution of this low volatility period could potentially be something worth basing a decision on. For intraday traders, the lower timeframe shows what’s possible within the range.
Gold (XAU/USD) 4-hour chart
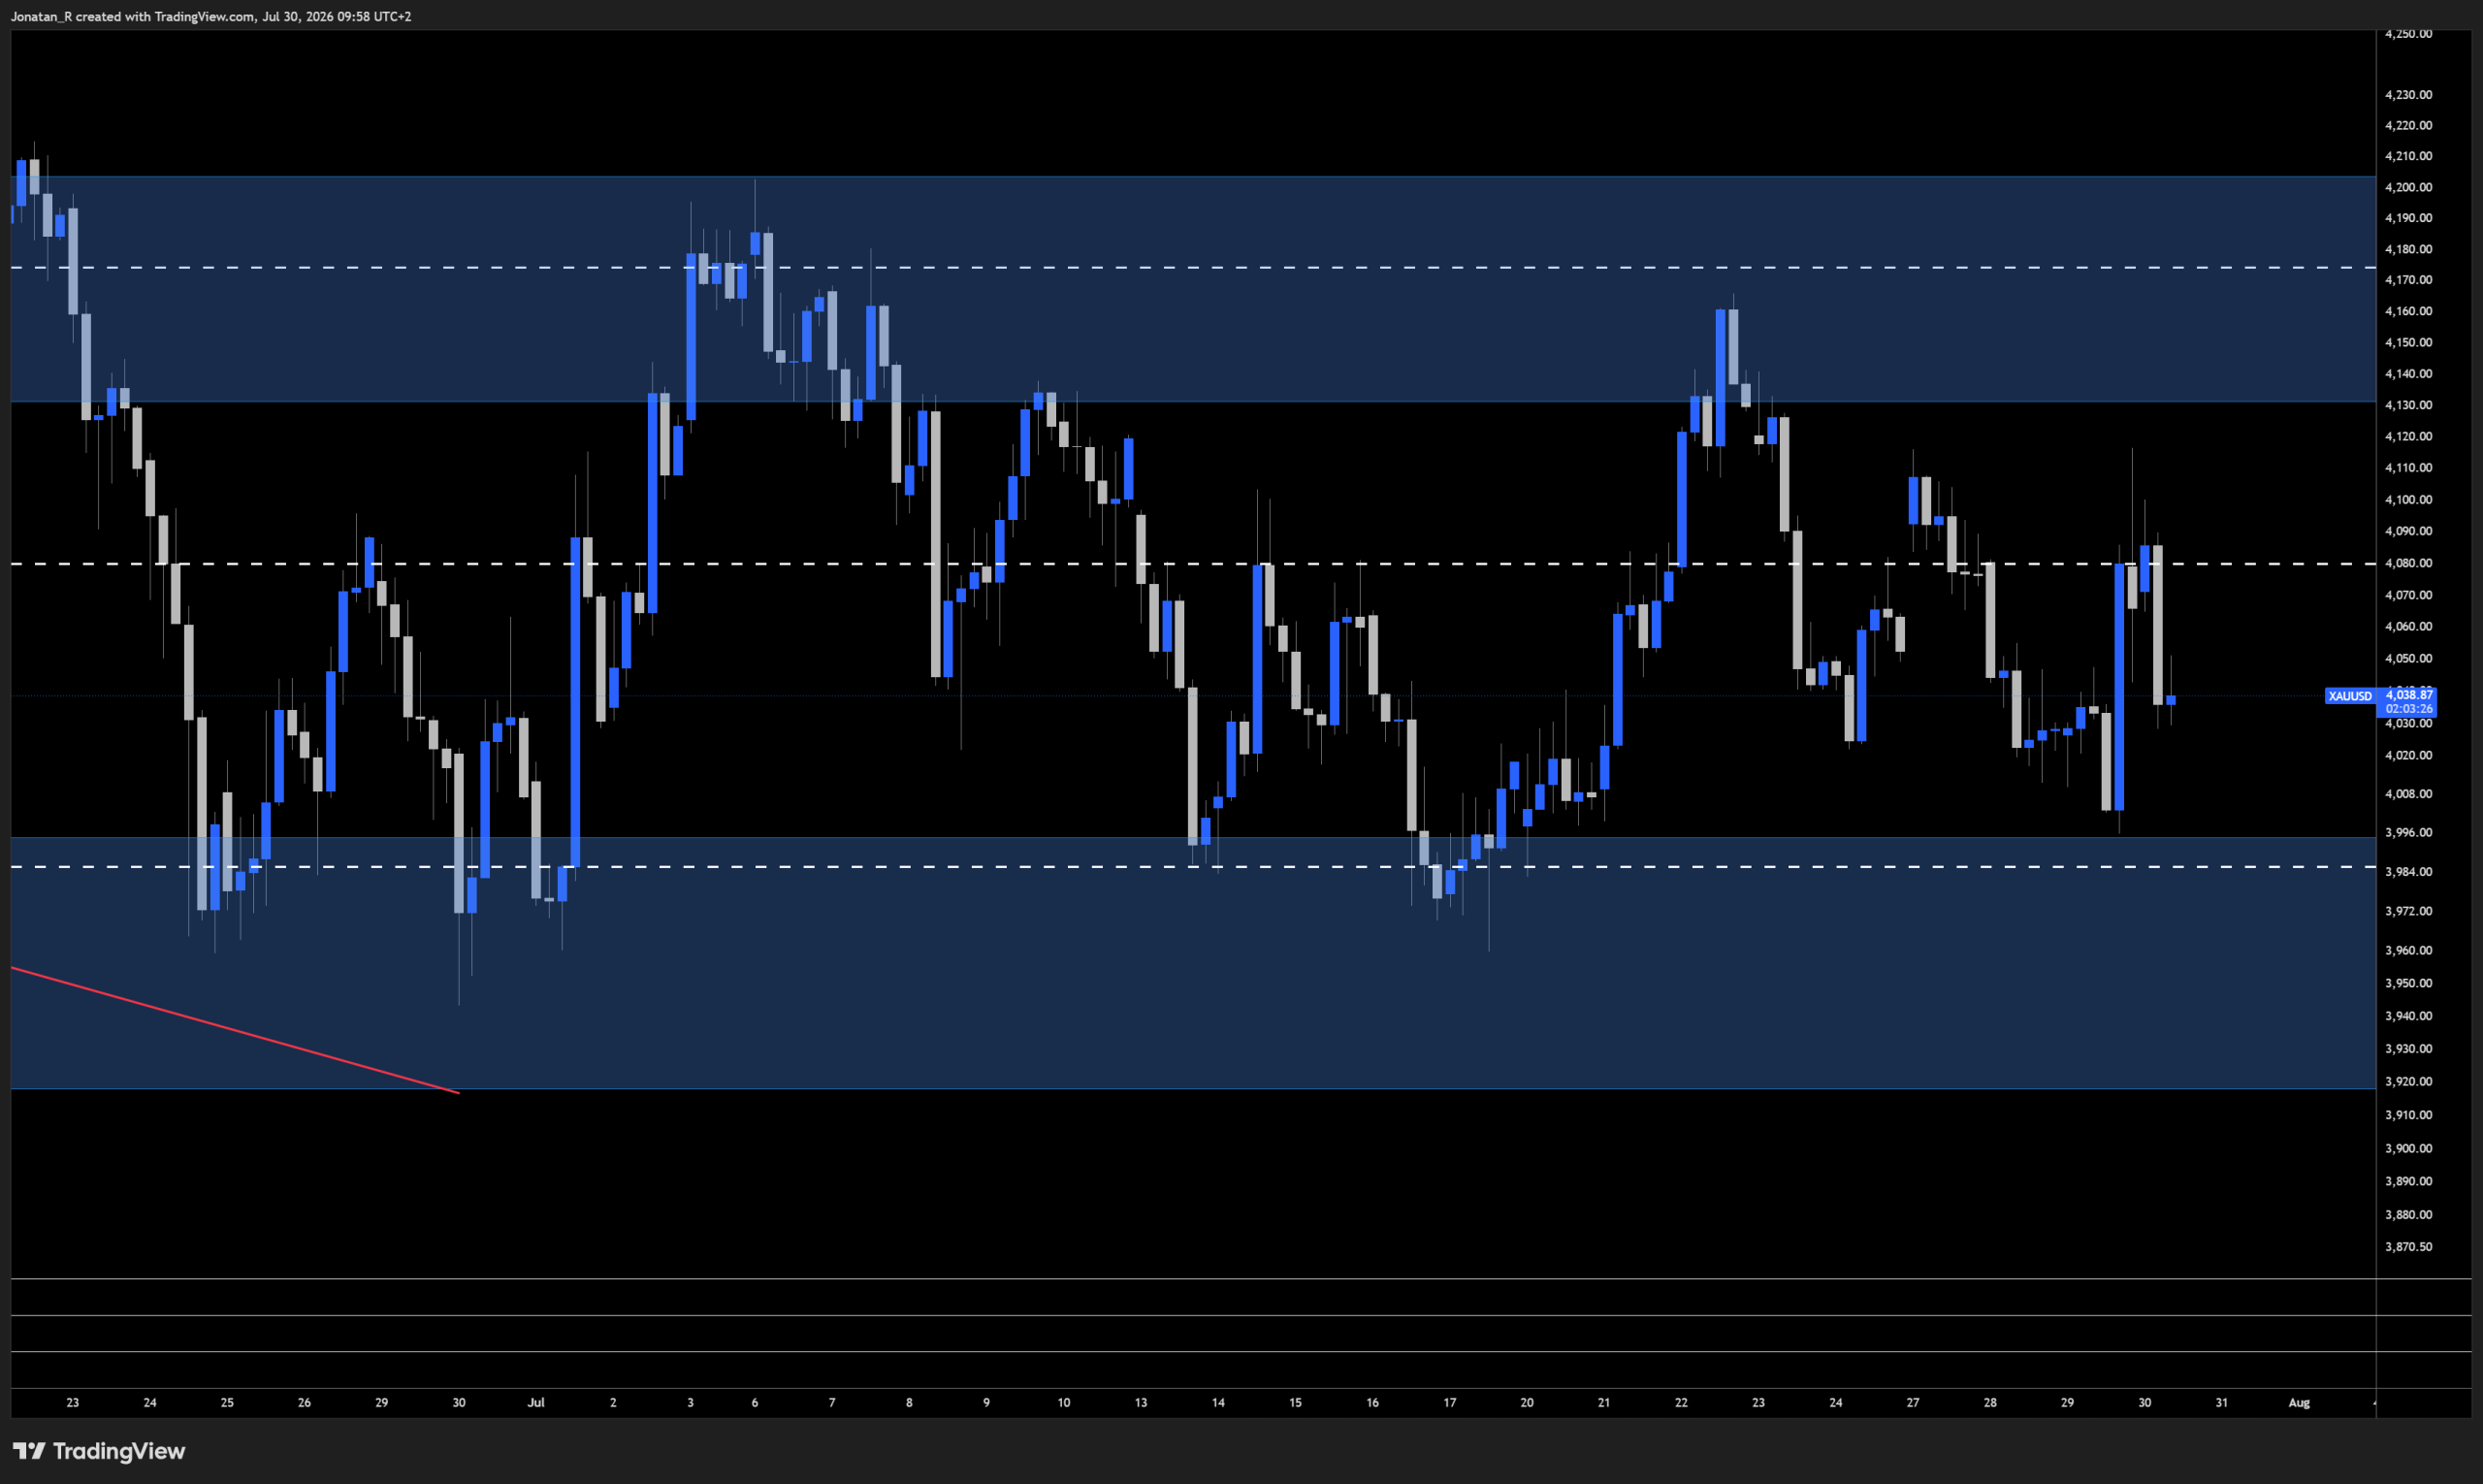
Gold’s 4-hour range with the lows just below 4,000, equilibrium around 4,080 and the highs near 4,175.
On the 4-hour chart we have a fairly clean range. The range lows sit right below 4,000, range equilibrium is around 4,080, and the range highs are around 4,175. Since around 22 July, price has been compressing quite a lot within this range, and it looks like it’s getting ready to expand.
For now, a range trader could be looking at the range lows for longs and the range highs for shorts. Risk management is crucial here, because when a move comes it could be a quick and violent one.
Key levels to watch
Upside
- 4,175: 4-hour range highs
- 4,200: top of the daily range, a break above could potentially confirm a volatility expansion to the upside
- 4,300 to 4,400: potential upside area on a sustained break above 4,200
Downside
- 4,080: 4-hour range equilibrium
- 4,000: base of the daily range, a break below could potentially validate a volatility expansion to the downside
- 3,700: potential downside area on a sustained break below 4,000
Trading involves risk.
Author



 Risk Disclaimer
The content provided here is for informational purposes only. It is not intended as personal investment advice and does not constitute a solicitation or invitation to engage in any financial transactions, investments, or related activities. Past performance is not a reliable indicator of future results.
The financial products offered by the Company are complex and come with a high risk of losing money rapidly due to leverage. These products may not be suitable for all investors. Before engaging, you should consider whether you understand how these leveraged products work and whether you can afford the high risk of losing your money.
The Company does not accept clients from the Restricted Jurisdictions as indicated in our website/ T&C. Some services or products may not be available in your jurisdiction.
The applicable legal entity and its respective products and services depend on the client’s country of residence and the entity with which the client has established a contractual relationship during registration.