5 min read
 Gold has fallen to a nearly four-week low after the Fed chair’s Jackson Hole keynote revived bets on a rate hike this month, with Treasury yields at their highest since January 2025 and a firmer dollar adding to the pressure. Renewed escalation between the US and Iran has lifted crude to a fresh high since late July, which for now is reinforcing the inflation story rather than gold’s usual crisis bid.
The daily chart
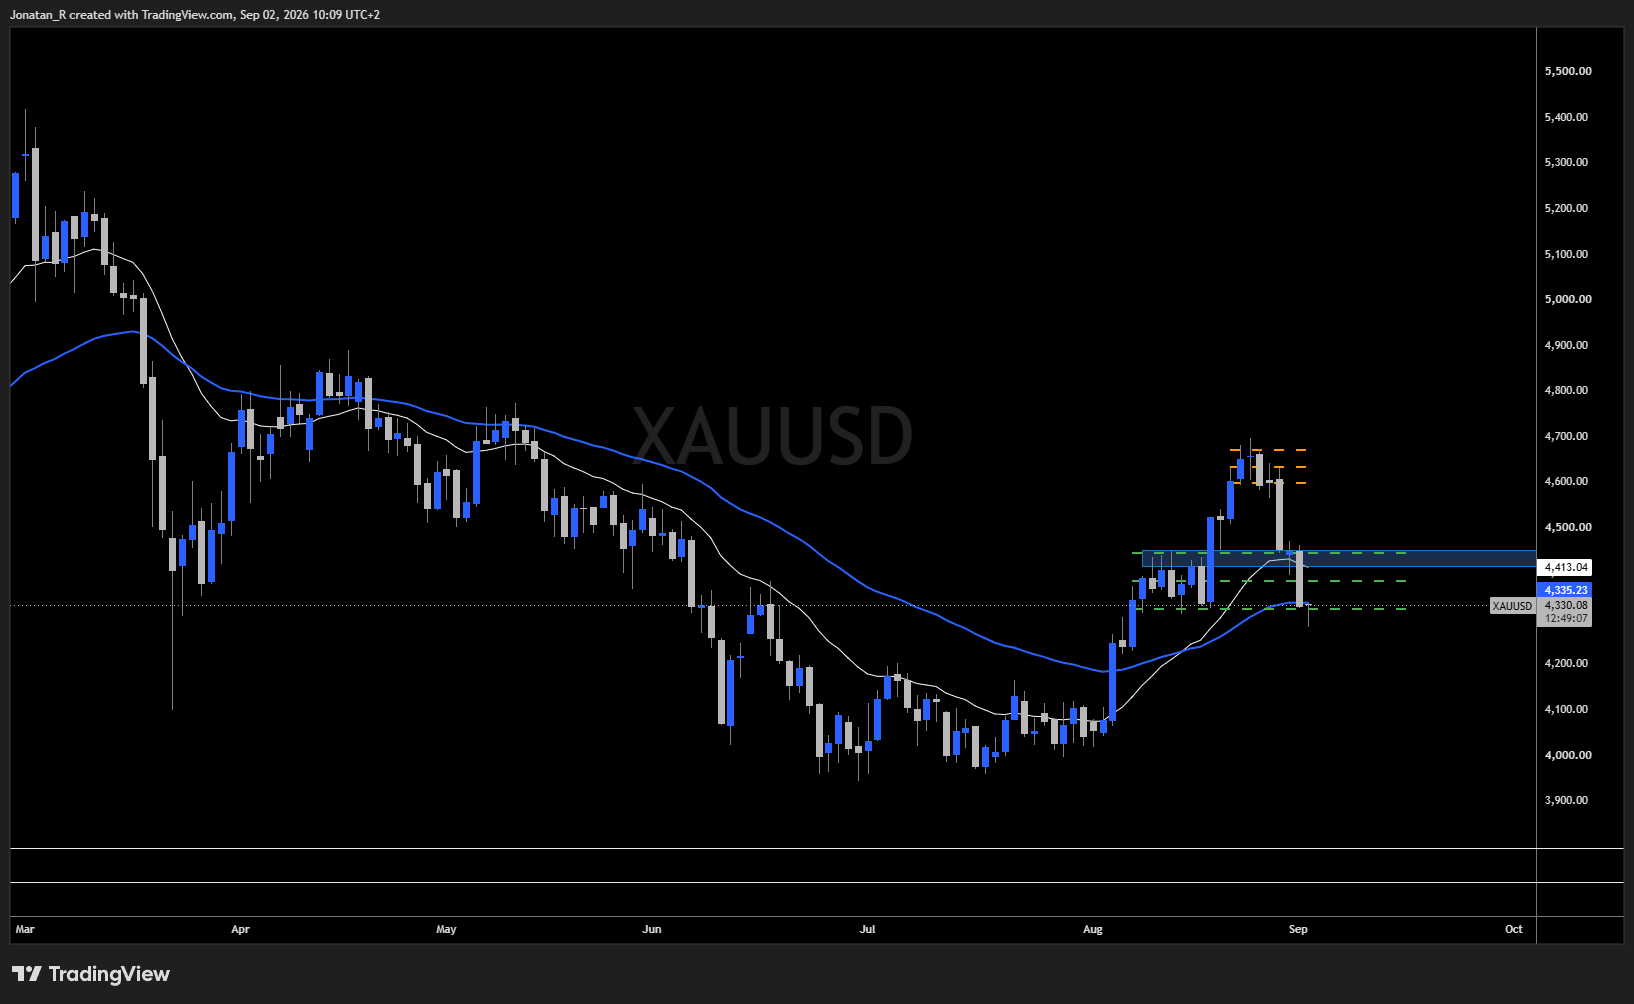
Gold on the daily timeframe, showing the break back below 4,400 and the test of the August range lows.
Gold first broke below the 4,400 level and moved back into the range that was formed in August, which is the scenario that opened up in our previous coverage of gold, where the 4,600 range low was the level that mattered and 4,450 sat beneath it as the next area of interest. Both have since given way. Price is now testing the range lows of that area and is trading right below the daily 50 EMA for the first time since breaking above it at the beginning of August.
This is a crucial moment for gold, as price is very close to a significant break in market structure. The level is clearly defined, and with the current price action this could either be a bearish rejection of the level or a potential reclaim of it.
The 4-hour chart
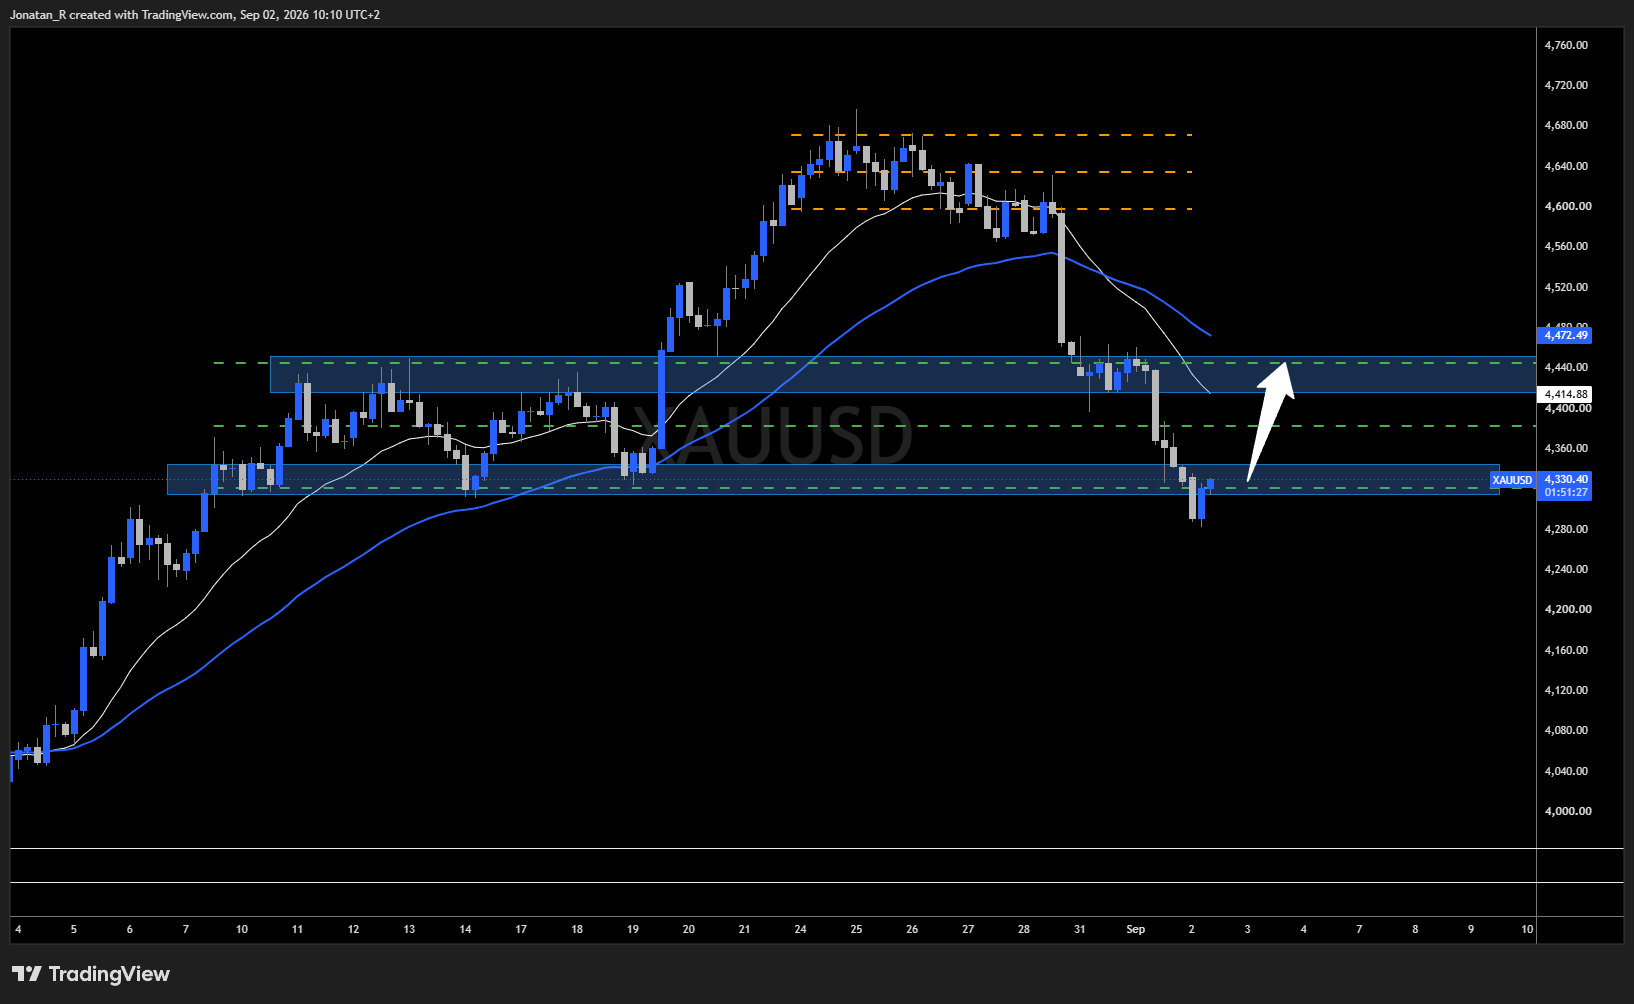
The 4-hour chart, with the 4,440 area sitting above price where the 20 and 50 EMAs converge.
If this turns out to be a reclaim of the level, we could potentially come up and retest the 4,440 level above, where we also have the 4-hour EMA area between the 4-hour 20 and 50 EMAs. That confluence is what makes the level worth watching on any move higher rather than just the horizontal on its own.
The 1-hour chart
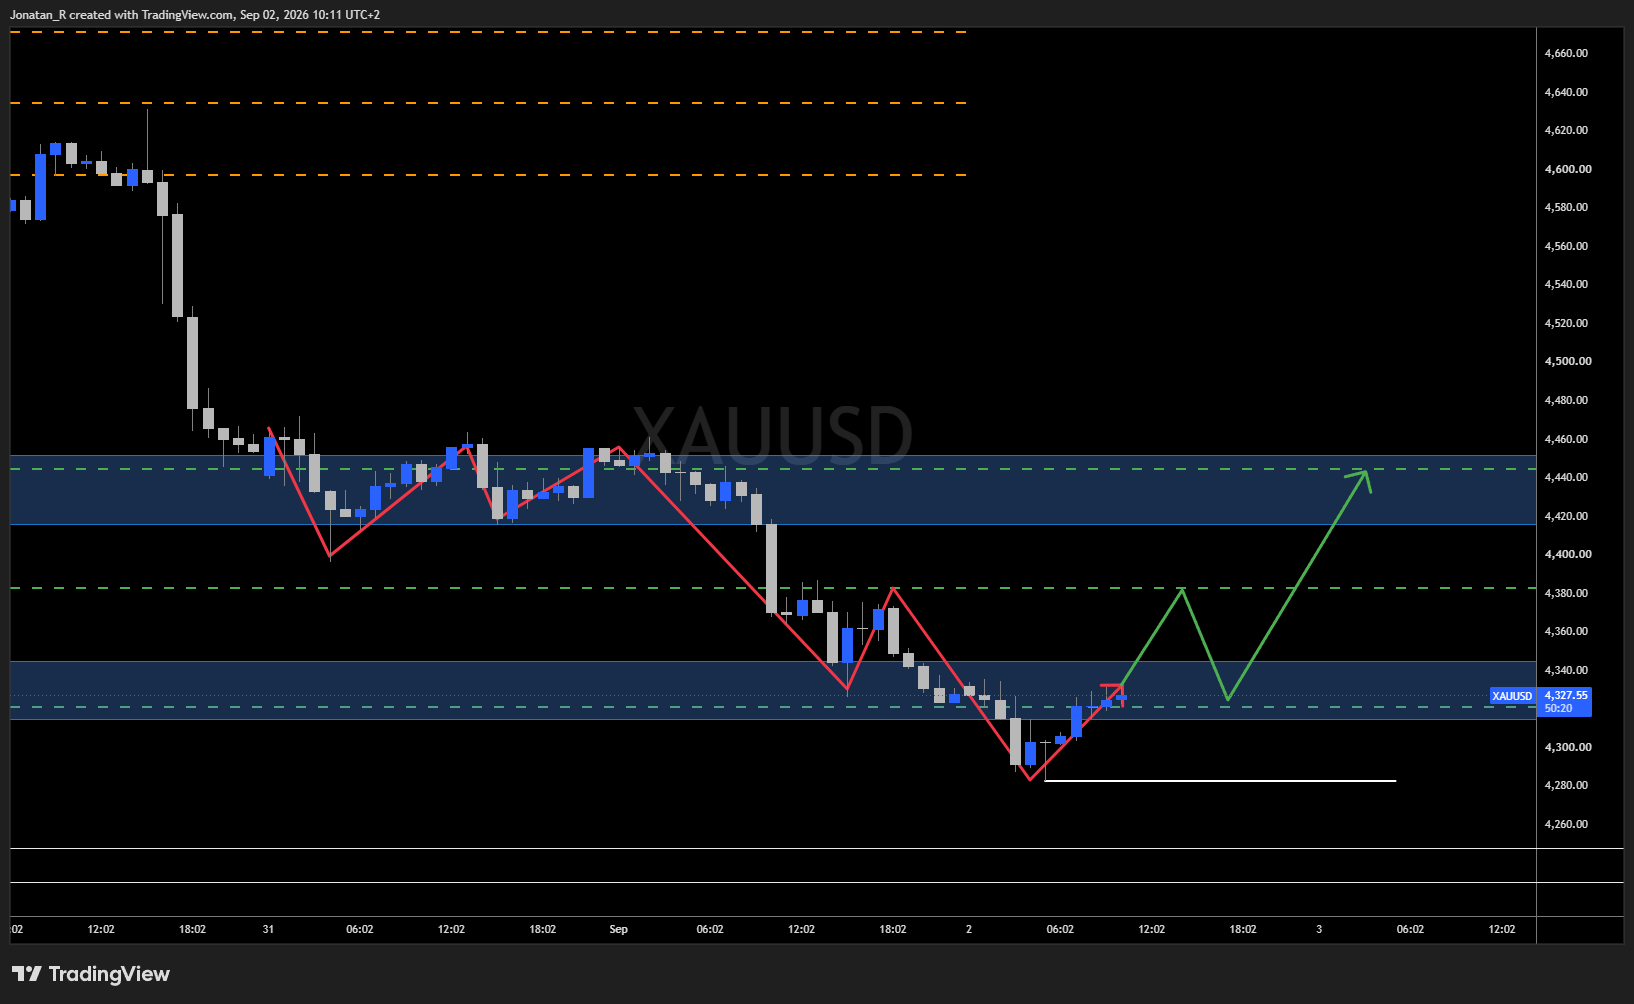
The 1-hour chart, showing the downtrend from the 4,440 area and the 4,280 level below.
Going into the 1-hour chart, the downtrend becomes even clearer. We had some consolidation around that 4,440 level, and it broke down and initiated the downtrend from there. If we break this trend and create a higher low, that could be a potential sign of a move up into the 4,440 level and could print a type of inverted head and shoulders here for gold.
If this move fails and we break below the 4,280 level, marked with the white horizontal line below, we could potentially see a deeper retracement on gold. This current bull run could potentially be over.
Trade Now
Trading involves risk.
Author



 Risk Disclaimer
The content provided here is for informational purposes only. It is not intended as personal investment advice and does not constitute a solicitation or invitation to engage in any financial transactions, investments, or related activities. Past performance is not a reliable indicator of future results.
The financial products offered by the Company are complex and come with a high risk of losing money rapidly due to leverage. These products may not be suitable for all investors. Before engaging, you should consider whether you understand how these leveraged products work and whether you can afford the high risk of losing your money.
The Company does not accept clients from the Restricted Jurisdictions as indicated in our website/ T&C. Some services or products may not be available in your jurisdiction.
The applicable legal entity and its respective products and services depend on the client’s country of residence and the entity with which the client has established a contractual relationship during registration.