18 min read
 The Dow Jones Industrial Average trades near 53,600 in late August 2026, about 1.4% below the record close of 54,349.12 it set on 5 August. The Dow (available on PrimeXBT as an index CFD) tracks 30 large US companies and is the oldest benchmark still in daily use, and its defining quirk is that it weights those companies by share price rather than by size. This page sets out PrimeXBT’s outlook through 2030 and out to 2050, what that weighting method does to the index’s behaviour, the rotation that has finally worked in the Dow’s favour, and the dated events ahead. One thing separates this forecast from the other two US indices: no investment bank publishes a Dow target, so every number below is our own model rather than an echo of Wall Street’s.
Dow Jones outlook at a glance
- 2026 base case: 52,014–56,952 points, averaging near 54,200 over the remaining months, with a year-end anchor around 54,500.
- The coverage gap: no bank publishes a year-end Dow target and no prediction market runs a year-end range contract on it, so the only Dow numbers in circulation are algorithmic and are not used here.
- Biggest downside risk: financials are roughly 27% of the index, so a renewed climb in long-term Treasury yields hits the Dow through its largest sector.
- Long-term view: the outlook compounds at about 5% a year in price terms, close to the index’s own long-run record, and figures past 2030 are a trajectory rather than a level.
Live Dow Jones chart
Current pricing is on the chart below; the levels worth watching are set out in the technical section.
Trading involves risk.
Dow Jones forecast 2026–2030
PrimeXBT’s expected range for each year, in index points:
| Year | Minimum | Average | Maximum |
|---|---|---|---|
| 2026 | 52,014 | 54,200 | 56,952 |
| 2027 | 52,052 | 56,396 | 62,640 |
| 2028 | 53,489 | 59,432 | 65,376 |
| 2029 | 54,915 | 62,404 | 69,892 |
| 2030 | 56,351 | 65,524 | 74,698 |
That path is deliberately less steep than the one this outlook applies to the Nasdaq 100, and the reason is structural rather than pessimistic. On matched ETF data the Dow’s largest sector is finance at roughly 27% of the index against about 13% for the S&P 500, while its weight in the electronics and hardware complex is around a third of the S&P’s. That mix earns its returns from lending margins, capital-goods demand and healthcare pipelines rather than from artificial-intelligence capital spending. It also prices more cheaply: on the same matched data the Dow sits near 20.8 times earnings against 22.5 for the S&P 500, yielding about 1.4% against 1.0%.
Dow Jones forecast 2026
PrimeXBT expects the Dow to end 2026 near 54,500, a fraction above the August record, inside a range of roughly 52,014 to 56,952 for the remaining months. The index has already logged 24 record closes this year and its best first half since 2021, so the base case is continuation rather than breakout. Only forward months appear below.
| Month (2026) | Minimum | Average | Maximum |
|---|---|---|---|
| September | 52,014 | 53,900 | 55,786 |
| October | 52,044 | 54,100 | 56,156 |
| November | 52,074 | 54,300 | 56,526 |
| December | 52,048 | 54,500 | 56,952 |
September and October are where the risk sits, and not only because of the Federal Reserve. Bank of America’s Bull & Bear Indicator hit 9.6 in late July, which Michael Hartnett called the strongest sell signal since 2021, and in midterm election years since 1974 the US market’s median return from the start of August to election day has been zero.
Dow Jones forecast 2027
PrimeXBT’s 2027 range runs from about 52,052 to 62,640, averaging near 56,396, with the monthly path climbing from roughly 54,800 in January to 58,000 by December. The argument for a better 2027 than 2026 rests on the Dow’s own components rather than on the market as a whole: the index’s financial constituents trade near 11.8 times forward earnings against 18.7 for the S&P 500 as a whole, which leaves room for that gap to narrow if the yield curve behaves.
| Month (2027) | Minimum | Average | Maximum |
|---|---|---|---|
| January | 52,052 | 54,792 | 57,531 |
| February | 52,179 | 55,083 | 57,988 |
| March | 52,304 | 55,375 | 58,446 |
| April | 52,428 | 55,667 | 58,905 |
| May | 52,550 | 55,958 | 59,367 |
| June | 52,670 | 56,250 | 59,830 |
| July | 52,789 | 56,542 | 60,294 |
| August | 52,907 | 56,833 | 60,760 |
| September | 53,022 | 57,125 | 61,228 |
| October | 53,137 | 57,417 | 61,697 |
| November | 53,249 | 57,708 | 62,168 |
| December | 53,360 | 58,000 | 62,640 |
Dow Jones forecast 2028–2030
Beyond 2027 the model compounds at about 5% a year in price terms from the end-2027 anchor, giving averages near 59,432 in 2028, 62,404 in 2029 and 65,524 in 2030, with bands widening from 10% to 14%.
That rate is chosen to sit close to what the index has actually delivered rather than above it. Measured across every 30-year holding period on record, the Dow has returned an average of 10.12% a year with dividends reinvested and about 5.5% a year on price alone. Add the index’s roughly 1.4% yield to a 5% price path and the total sits a little under the historical average, which is the appropriate posture from a starting point where long-term borrowing costs are at a 19-year high.
Dow Jones long-term forecast: 2035, 2040, 2050
The Dow is 130 years old and has held only a handful of its original members, so a level for 2050 describes a survivorship-selected portfolio nobody can name today. Slowing the compounding to 4.5% beyond 2030 gives the following, and the width matters more than the midpoint:
| Year | Minimum | Average | Maximum |
|---|---|---|---|
| 2035 | 65,480 | 81,850 | 98,220 |
| 2040 | 76,500 | 102,000 | 127,500 |
| 2050 | 102,962 | 158,402 | 213,843 |
What analysts say, and why there is so little of it
Not one of the major banks publishes a year-end Dow Jones target. Every 2026 outlook from BofA, Citi, Goldman Sachs, Morgan Stanley, JPMorgan, UBS, Barclays, Deutsche Bank, Wells Fargo, RBC, HSBC and Yardeni Research carries an S&P 500 number and no Dow number. Prediction markets have the same gap: Kalshi runs year-end range contracts on the S&P 500 and the Nasdaq 100 and none on the Dow, though it does quote the index intraday.
The nearest thing to a named long-horizon call is Yardeni Research’s Dow 60,000 by 2030, and it dates from May 2024, when the index had just cleared 40,000. At 53,600 that target is 12% away with four years to run, and Yardeni’s own 2026 refresh gives S&P 500 figures only. Anything else in circulation comes from algorithmic forecast sites whose Dow numbers for 2027 alone span 58,000 to 84,000. A range that wide is not a forecast, and none of it informs the tables above.
The pattern is telling. The S&P 500 is the institutional benchmark, so it gets modelled; the Dow is a headline number, so it gets quoted constantly and modelled almost never.
Track record of this forecast
This is PrimeXBT’s first published Dow Jones forecast. At each monthly review from here, this section will put the prior forecast next to the index’s actual level and explain the difference, whichever way it went.
Why price weighting changes everything
The Dow is the only major index that weights its members by share price. The level is the sum of 30 share prices divided by a fixed divisor, which S&P Dow Jones Indices resets whenever a split, spin-off or substitution would otherwise move the index without any economic change. The last published divisor, 0.16242563904928 as of October 2025, meant a one-dollar move in any single constituent shifted the index by about 6.16 points. Two corporate actions in June 2026 have since forced a reset that has not been published.
The consequences are not academic. Goldman Sachs, a $308 billion company, carries roughly 11.77% of the Dow because its shares trade above $1,000. Nvidia, at more than $5 trillion the largest company in the index by a wide margin, sits outside the top ten because its share price is low. Caterpillar outweighs Microsoft. Ten names account for around 55.6% of the index, up from 52.9% in 2021, and the largest single weight has climbed from 7.75% to 11.77% over the same span. For a comparison of how differently the three US benchmarks are built, PrimeXBT’s breakdown of the Dow, Nasdaq and S&P 500 is the place to start.
Membership is a committee decision, not a formula. The Averages Committee, three representatives from S&P Dow Jones Indices and two from The Wall Street Journal, selects on reputation, sustained growth and investor interest, with no quantitative screen and no scheduled reconstitution. Changes arrive with one to five days’ notice. In June 2026 the committee replaced Verizon, whose $45 share price gave it half a percentage point of the index after 22 years, with Alphabet at $345, which entered as the sixth most influential name. The same day Honeywell spun off its aerospace arm and the parent stayed in under a new name. Both events moved the divisor. Nike, whose shares have given back most of their gains since a 2013 addition, is the constituent most often named as next out.
Dow Jones technical analysis
On Barchart’s daily series the Dow sits comfortably above both of its main moving averages, about 1.7% over the 50-day at 52,726 and 7.9% over the 200-day at 49,651, both of which have risen through the year. The 14-day RSI reads 55.7, mid-range, so there is no overbought signal on the daily chart despite the index sitting near a record.
The index is trading inside the contested 53,500 to 53,750 zone, with a Fibonacci resistance level at 53,602 sitting just above an Ichimoku cloud that spans 53,249 to 53,573, a configuration that tends to produce choppy trade rather than trend. Above that, 54,000, then the record shelf at 54,349 on a closing basis and 54,744 intraday. Support runs 53,200 to 53,300 first, then a high-volume band at 52,800 to 53,000, then 52,300 to 52,400. The 14-day average daily range is around 329 points, worth knowing before setting a stop. All readings are as of publication; providers computing on intraday bars publish very different moving averages for this index, which is why a single daily series is used throughout.
Correlation with other assets
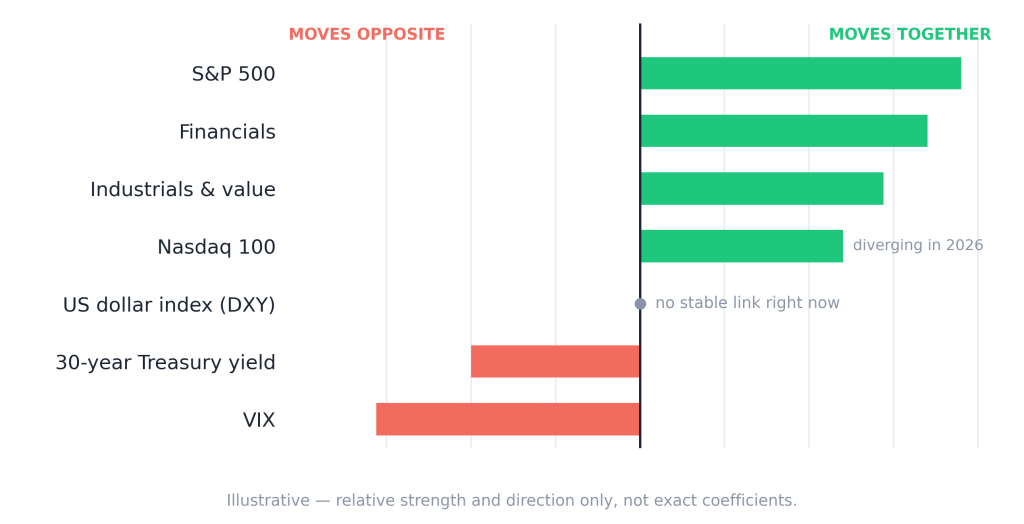
The Dow and the S&P 500 are close to the same trade. On S&P Dow Jones Indices’ own measurement the three-year rolling correlation between them averages 0.95 over the long run and has almost always sat above that average since 2009, with the low point of 0.86 coming in 2001. The Dow gets there with slightly less amplitude.
Where it separates is the interest-rate channel, and August showed the mechanism in both directions. The index fell 1.32% on 20 August when a US Treasury buyback plan failed to hold long yields down, then rose 0.98% the next session and again over the following two as the 30-year retreated from a 19-year high of 5.33%. With finance at 27% of the index, the Dow’s earnings are geared to the level and shape of the yield curve in a way that a technology-heavy benchmark is not: the same rise in long rates that compresses a growth multiple can widen a bank’s lending margin. Read the picture above as this cycle’s arrangement, since sector mix decides these relationships and the mix changes.
Fundamental factors
The Dow’s 2026 has been the rotation trade. Through the first half the index trailed the S&P 500 and the Nasdaq badly, then closed most of the gap in July and August as capital moved out of the year’s winners: on 24 August, 19 of the 20 best-performing large US stocks of 2026 fell, by an average of 2.7%, while financials traded near record highs and Fundstrat’s Mark Newton described “a massive amount of rotation” into financials, industrials and healthcare. On 2 July the Dow closed at a record 52,900 while the Nasdaq 100 fell in the same session on chip weakness.
The rotation has not made the Dow the winner, and it is worth being precise about that. On a like-for-like price-return basis the Dow is up about 11.1% in 2026 against 12.2% for the S&P 500 and 15.7% for the Nasdaq 100. It is a strong year that is still third of three.
Valuation is where the case is strongest. On matched ETF data the Dow trades at 20.8 times earnings yielding about 1.4%, the S&P 500 at 22.5 times yielding about 1.0%. The index’s financial constituents sit near 11.8 times forward earnings and carry roughly half the market’s debt relative to equity. Against that, the income argument has a hard ceiling while the ten-year Treasury pays 4.70%: a 1.4% index yield is no substitute, so the dividend case here rests on growth rather than level. Adding Alphabet in June lifted the index’s big-tech exposure and narrowed an underweight the committee had tolerated for years, which is the clearest signal of where it thought the gap was.
Upcoming catalysts
Only confirmed, dated events are listed. Note what is missing: unlike the S&P 500 and the Nasdaq 100, the Dow has no scheduled rebalancing date, so constituent changes cannot be diarised at all.
| Date | Event | Potential impact |
|---|---|---|
| 4 September 2026 | August employment report | Weak payrolls cut both ways: rate relief against cyclical demand |
| 11 September 2026 | August CPI | Long-end yields are the transmission channel into financials |
| 15–16 September 2026 | FOMC meeting, with economic projections | Rates held again in July at 3.50%–3.75%; the projections carry the signal |
| 13 October 2026 | Q3 earnings season opens with the large banks | Directly relevant: JPMorgan, Goldman Sachs and Travelers are all constituents |
| 27–28 October 2026 | FOMC meeting | No projections, so the statement language does the work |
| 3 November 2026 | US midterm elections | Industrials and healthcare are the components most exposed to policy shifts |
| 8–9 December 2026 | FOMC meeting, with economic projections | Sets the 2027 rate frame |
FOMC dates follow the Federal Reserve’s published 2026 schedule and the CPI and payroll dates the Bureau of Labor Statistics calendar. CPI also lands on 14 October, 10 November and 10 December, and payrolls on 2 October, 6 November and 4 December.
Bull case vs bear case
Bull case:
- On matched ETF data it trades at roughly an 8% earnings-multiple discount to the S&P 500 with about 40 basis points more yield.
- Financials, its largest sector at 27%, trade near 11.8 times forward earnings against 18.7 for the S&P 500 as a whole.
- Rotation out of 2026’s crowded winners has been running since July, and this index is the natural destination for it.
- Every 30-year holding period in the index’s recorded history has produced a positive total return, averaging 10.12% a year.
Bear case:
- The 30-year Treasury yield reached a 19-year high in August, and the index fell 1.3% in a single session when an attempt to cap long yields failed.
- Bank of America’s sentiment gauge flagged its strongest sell signal since 2021 in late July, a reading historically followed by drawdowns of 15% to 20% at the extreme.
- August to October is the market’s weakest seasonal window, and midterm years have historically produced a flat market into the vote.
- Concentration is worse than the 30-name count implies: ten stocks are 55.6% of the index and one is 11.77%, entirely because of its share price.
Invalidation levels. The constructive case needs the 52,800 to 53,000 volume shelf to hold; losing it puts 52,300 in play and would break the pattern of higher lows that has held since spring. The bearish case fails on consecutive closes above 54,349, which would confirm the August record as a base rather than a ceiling.
Will the Dow Jones crash in 2026?
No forecast worth reading claims to know, and this index carries the longest crash record of any, so the question deserves numbers rather than reassurance. The Dow lost 89% between September 1929 and July 1932, 54% in the financial crisis, about 38% in the dot-com unwind and roughly 32% in the five weeks to mid-March 2020. It also fell 22% from its January 2022 peak and finished that year down 8.8%.
Recovery has been reliable on long horizons and slow on short ones: every 30-year window has been positive, and the 1929 drawdown took a generation to repair. For 2026 the named risks are a sentiment extreme and a rate shock rather than a systemic break. The 15% to 20% drawdown implied at the worst of that sell-signal history would take the index to somewhere between 42,900 and 45,600, below the floor of the range above and back toward the 200-day average. A correction of that size is a different event from a bear market, and conflating the two is how people sell the wrong thing.
Historical performance
Price returns since 2016 read: 13.42%, 25.08%, −5.63%, 22.34%, 7.25%, 18.73%, −8.78%, 13.70%, 12.88%, 12.97%, and 11.14% so far in 2026. Two down years in eleven and no year worse than 8.8%, which is a materially smoother series than the Nasdaq 100’s over the same span. Dividends add roughly two percentage points a year on top: the index owner put 2025 at 12.97% on price and 14.92% including dividends.
Over the very long run the gap with the S&P 500 is smaller than the 2026 scoreboard suggests. On the index owner’s own figures the Dow beat it over both the 20- and 30-year windows to April 2021, 8.53% against 8.35% and 11.16% against 10.60% annualised, at almost identical volatility.
Is the Dow Jones a good investment in 2026?
The Dow is the cheapest of the three US benchmarks on trailing earnings, pays the most income, carries the least AI exposure and has trailed both the others this year. Whether that is an opportunity or a structural problem turns on one thing: whether the rotation that began in July is a regime change or an episode.
Two cautions. Thirty names weighted by share price is a narrower exposure than the blue-chip label suggests, so treat the diversification here as limited. And holding the index for decades has almost nothing in common with trading a leveraged index CFD over days. PrimeXBT offers the second, and a view on 2030 is not a reason to open a position this afternoon.
How to trade the Dow Jones on PrimeXBT
PrimeXBT lists the Dow as an index CFD that can be held long or short regardless of which way this forecast points. The guides to trading the Dow Jones and to index trading cover the setup, and the definition of the index is worth a minute if the price-weighting section above was new.
Three instrument-specific points. Cash index CFDs follow exchange hours, so gaps between close and open are normal and stops can fill beyond their level. Because the index is price-weighted, a single high-priced constituent reporting earnings can move it more than the company’s size implies, which is a position-sizing consideration rather than a curiosity. Overnight positions accrue a financing charge and spreads widen outside the main session, both covered in PrimeXBT’s breakdown of index CFD spreads. Leverage works in both directions, so set the size and the stop-loss before the entry. Trade your own analysis and risk tolerance, and never risk more than you can afford to lose.
Trading involves risk.
How we build this forecast
With no published bank targets to lean on, this outlook is entirely PrimeXBT’s own construction. The near-term anchor starts from where the index trades, its position against the 50- and 200-day averages, and the balance between its valuation discount and the pressure from long-term interest rates. The 2027 anchor works from the earnings and multiple of the index’s largest sectors, chiefly financials, rather than from a market-wide estimate. From 2028 the path compounds at a rate set close to the Dow’s own long-run price return, and each band widens with the horizon because the uncertainty does.
None of it is a promise. A 30-stock, price-weighted index can be reshaped by one committee decision announced five days in advance, and one move in long-term yields can reprice its largest sector in a session. Treat every figure as a considered estimate. The outlook is reviewed and updated monthly.
What will the Dow Jones be in 2026?
PrimeXBT's outlook is roughly 52,014–56,952 points for the remainder of 2026, averaging near 54,200, with a year-end anchor around 54,500.
What will the Dow Jones be in 2030?
Our range is roughly 56,351–74,698, averaging near 65,524. That compounds the index's own long-run price return rather than forecasting events, so read it as a trajectory.
Where will the Dow Jones be in 10 years?
Around 81,850 on our central 2035 path, within a band of roughly 65,480 to 98,220.
Can the Dow Jones reach 60,000?
Not before 2027 on our numbers, when the top of the modelled band first clears 60,000. The only named long-horizon call on record, Yardeni Research's Dow 60,000, was set in May 2024 for 2030 and the index is now within 12% of it.
Why is the Dow weighted by share price?
Because it was designed in 1896, before market-capitalisation weighting became standard, and the method was never changed. It is why Goldman Sachs carries nearly 12% of the index on a $308 billion market value while Nvidia, worth more than $5 trillion, sits outside the top ten.
Author



 Risk Disclaimer
The content provided here is for informational purposes only. It is not intended as personal investment advice and does not constitute a solicitation or invitation to engage in any financial transactions, investments, or related activities. Past performance is not a reliable indicator of future results.
The financial products offered by the Company are complex and come with a high risk of losing money rapidly due to leverage. These products may not be suitable for all investors. Before engaging, you should consider whether you understand how these leveraged products work and whether you can afford the high risk of losing your money.
The Company does not accept clients from the Restricted Jurisdictions as indicated in our website/ T&C. Some services or products may not be available in your jurisdiction.
The applicable legal entity and its respective products and services depend on the client’s country of residence and the entity with which the client has established a contractual relationship during registration.