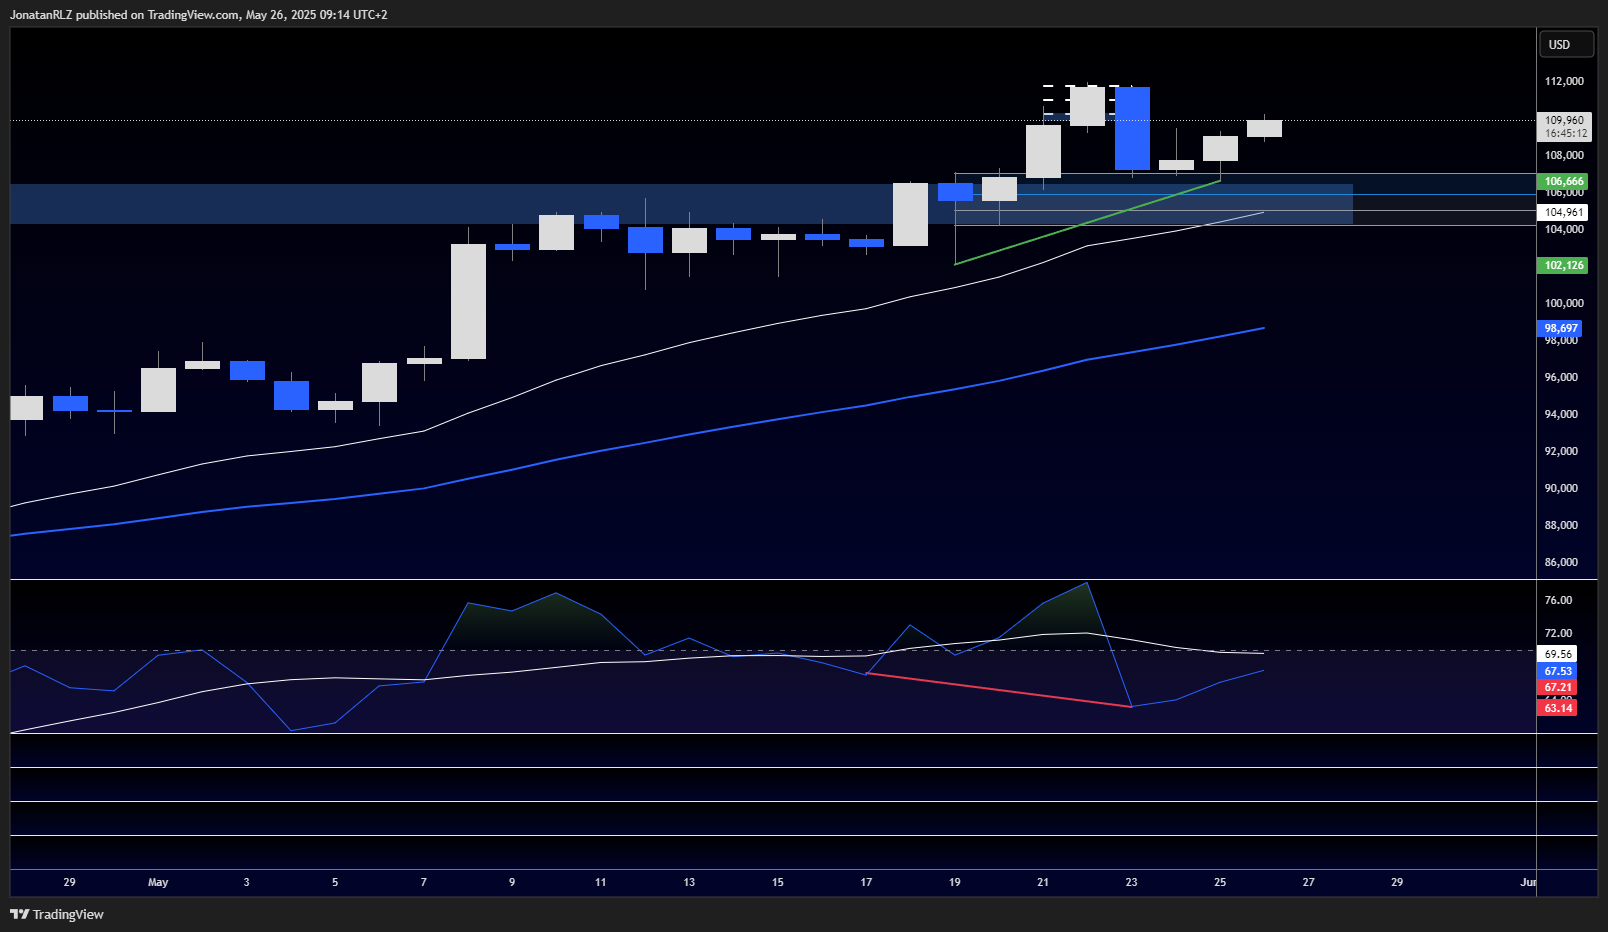
Following last week’s technical update, where we outlined the risk of a short-term pullback, Bitcoin has since broken down from its previous range and found support right on the 50% Fibonacci retracement level at around $107,000. Price reacted well at that level, and we are now seeing a constructive bounce.
Today, we focus on the daily, 4-hour and 1-hour time frames to assess the current structure.

On the daily, Bitcoin is still holding a clear uptrend with consistent higher highs and higher lows since early April. This daily trend has now been in place for over 50 days. The most recent higher low was printed exactly at the previous all-time high region, lining up with the 50% Fib retracement of the previous move.
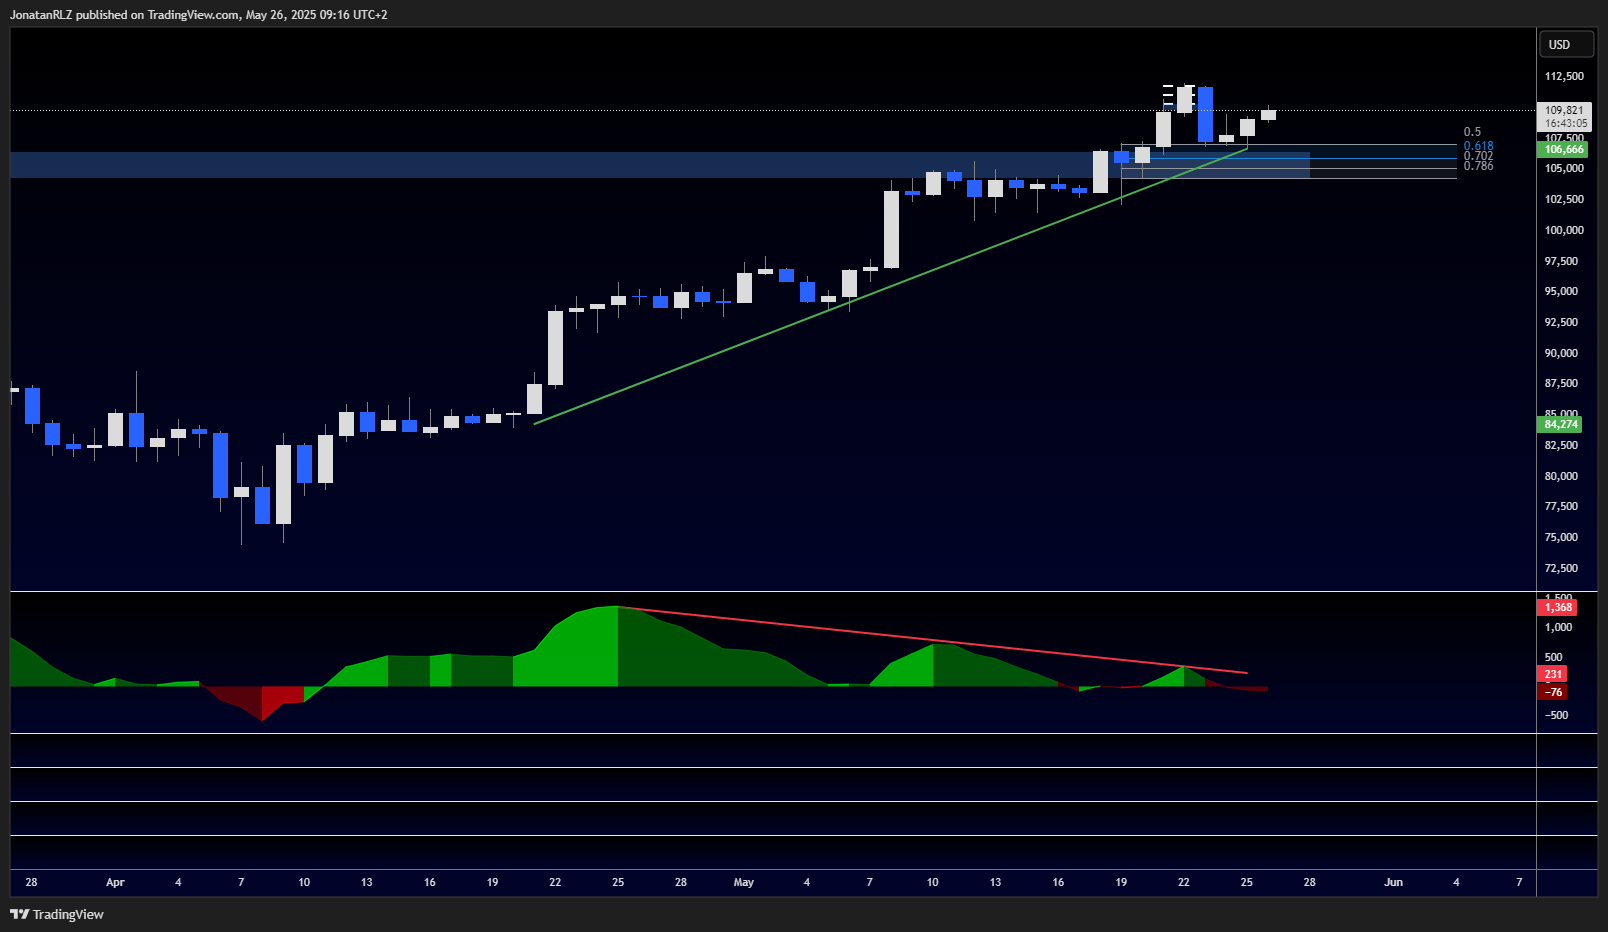
However, there are a few signs that suggest caution. In our previous article, we highlighted emerging bearish divergences on both the RSI and the MACD histogram. For those unfamiliar, a bearish divergence occurs when price continues higher while the indicators trend lower, indicating a possible loss in momentum.
Currently, price is forming higher lows, as shown by the green ascending trendline on the chart, while the RSI is making lower lows, highlighted with a red trendline. This divergence suggests that while price is moving higher, momentum is not confirming the strength of the move.
The same is visible on the MACD histogram, which is putting in a sequence of lower highs while price continues to move higher. This divergence remains active and, while not a signal of an immediate reversal, it’s worth monitoring closely, especially if price fails to reclaim the all-time high or enters a broader ranging structure.
Trading involves risk.

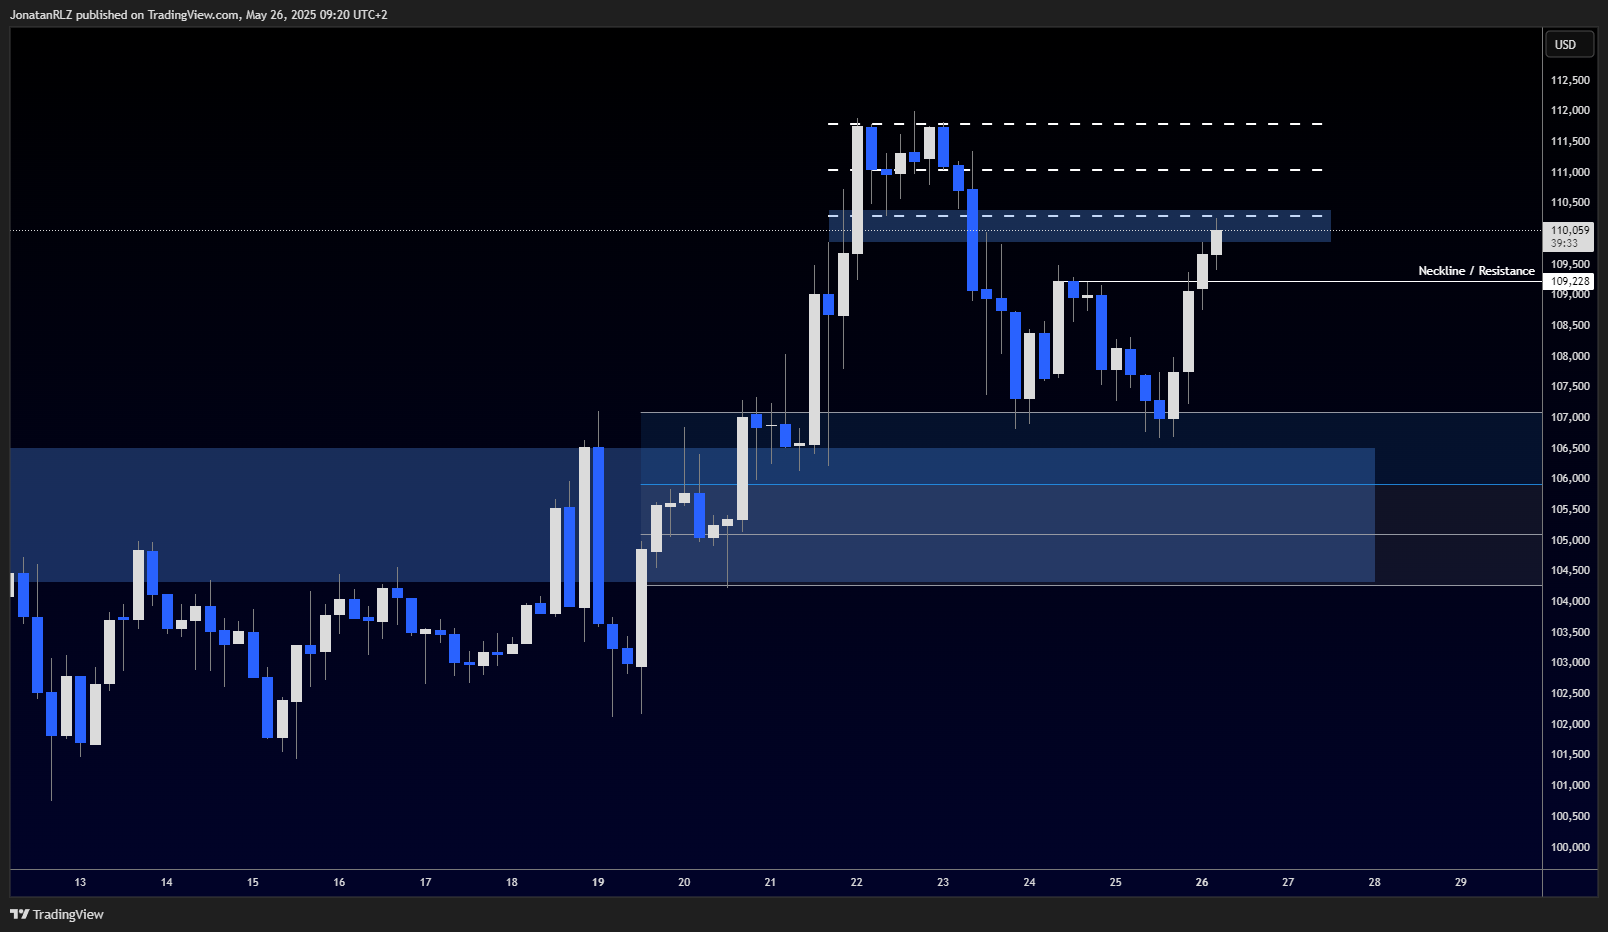
Dropping down into the 4-hour, we see a clean double bottom pattern, often referred to as a W-structure. The neckline of this pattern was broken recently, confirming the setup, and we are now testing the previous range low area. This is a significant region, as it marks the breakdown point that occurred on the back of Trump’s comments regarding new tariffs on the EU.
This zone is now acting as a key resistance level. A failure to reclaim it could lead to a new lower high on the daily chart, increasing the probability of a shift in structure. On the other hand, a clean break and reclaim would suggest that this was potentially a shakeout before continuation.

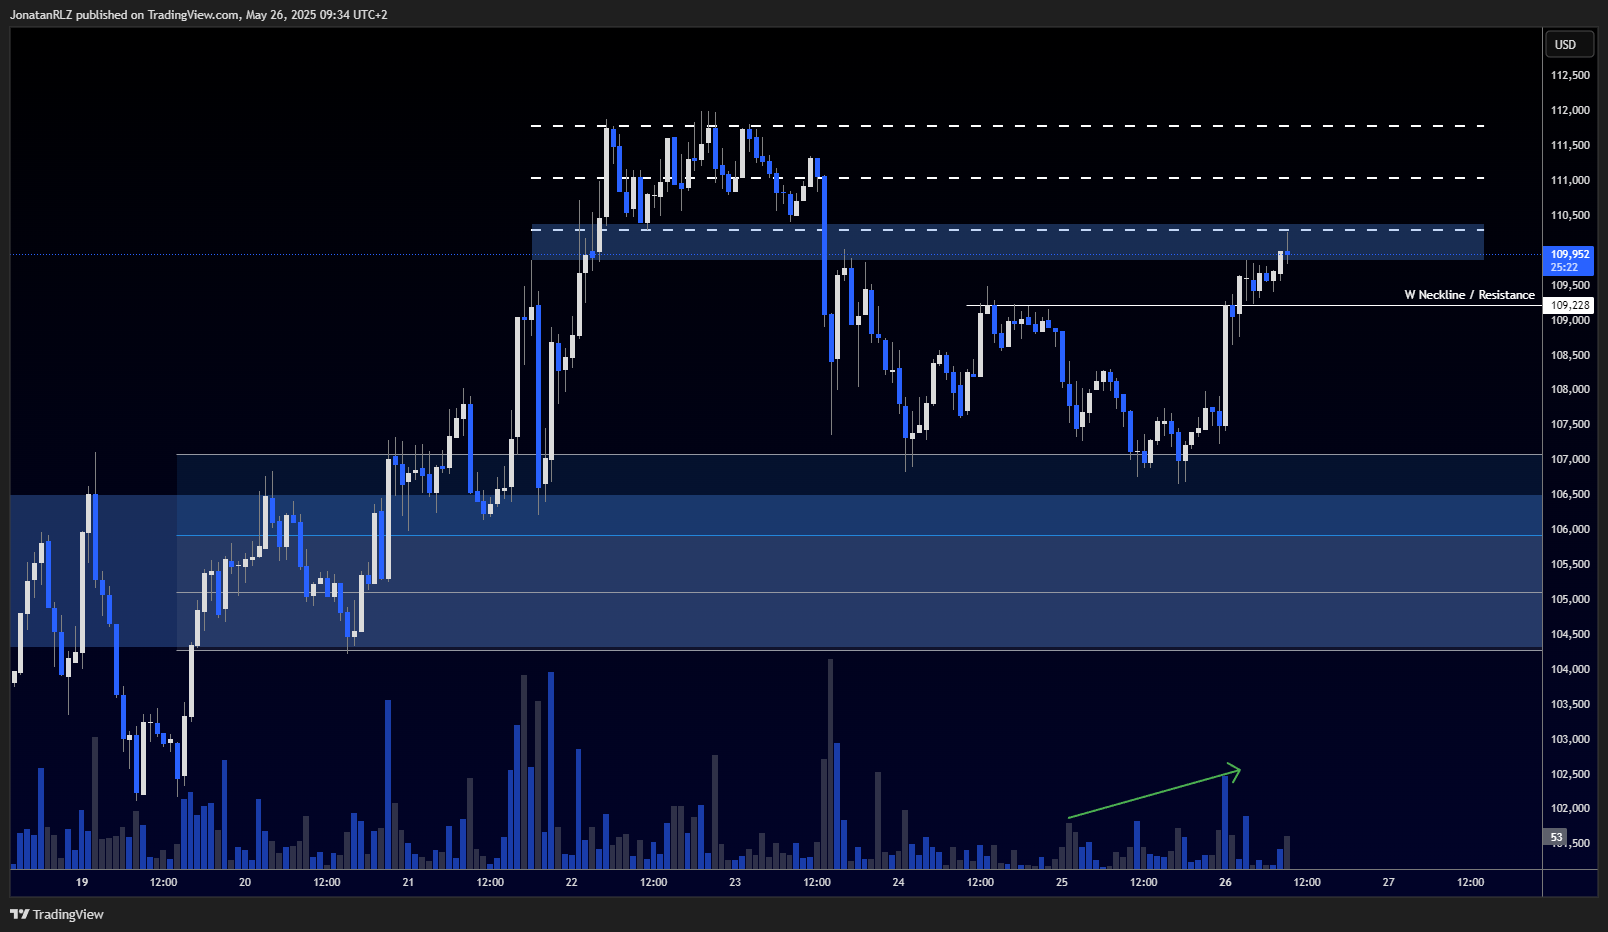
Zooming into the 1-hour, we observe a strong move above the double bottom neckline. Volume analysis shows a decreasing volume trend during the breakdown, followed by rising volume on the right leg of the double bottom, and a spike on the breakout. This volume behaviour supports the idea of strength returning to the market.
The critical level to watch now is the previous range lows around $110,000. A reclaim of this area with increasing volume would be a strong signal that bulls are regaining control, potentially setting the stage for a move back toward the all-time high at $112,000.
However, if we see a rejection at $112,000 and a failure to break above, this could create a possible double top on the daily, adding further weight to the ongoing bearish divergences on the RSI and MACD histogram.
It’s also worth noting that both US and UK markets are closed today due to public holidays, which may lead to reduced liquidity and potentially erratic price action during the day.
Stay tuned for further updates as we monitor these key technical levels.

Trading involves risk.
The content provided here is for informational purposes only. It is not intended as personal investment advice and does not constitute a solicitation or invitation to engage in any financial transactions, investments, or related activities. Past performance is not a reliable indicator of future results.
The financial products offered by the Company are complex and come with a high risk of losing money rapidly due to leverage. These products may not be suitable for all investors. Before engaging, you should consider whether you understand how these leveraged products work and whether you can afford the high risk of losing your money.
The Company does not accept clients from the Restricted Jurisdictions as indicated in our website/ T&C. Some services or products may not be available in your jurisdiction.
The applicable legal entity and its respective products and services depend on the client’s country of residence and the entity with which the client has established a contractual relationship during registration.


