8 min read
 Key takeaways
- Bitcoin (BTC) has pushed back above the $66,000 area, the zone that has capped every attempt higher this month, and is trading at the highs of that resistance.
- US spot Bitcoin exchange-traded funds (ETFs) have recorded five consecutive sessions of net inflows worth $727m, the longest run since April.
- The scale is modest against what came before. Roughly $8.6bn left these funds between early May and the end of June, and about $427m has returned in July, close to 5% of the outflow.
- Price has reclaimed the daily 50 exponential moving average (EMA) for the first time since losing it in May, with $70,000 the next resistance zone above and $60,000 the support below.
Bitcoin is testing the level that has defined its entire month. Price has climbed back above the $66,000 area after being rejected there on 15 July and sliding toward the low $62,000s, and every attempt higher since the start of July has stalled in the same zone. What’s changed isn’t the level, it’s the flow sitting behind it and the macro backdrop it’s being tested against.
The Fed is expected to hold, and a cut isn’t on the table
When we last covered Bitcoin on 16 July, a soft June inflation print was pulling down expectations of further Federal Reserve tightening. That has held. Markets now price an 83.4% probability that rates stay at 3.50% to 3.75% at the 29 July meeting, against 16.6% for a quarter-point increase, according to CME FedWatch. A month ago those odds sat at 61.5% and 38.5%, so the near-term threat of a hike has roughly halved. The probability of a cut is zero.
The longer view is where the pressure sits. Prediction market Polymarket puts the chance of at least one hike before the December meeting at 59%, having peaked near the high 60s in late June. Expectations have cooled from their highs without turning, and the debate among policymakers remains about whether to tighten rather than whether to ease.
The reason it hasn’t turned further is energy. US strikes on Iran entered a tenth consecutive day this week, Houthi militants announced a maritime embargo against Saudi Arabia, and Brent crude is up roughly 12.6% over the past month. Goldman Sachs has modelled that a move back toward $100 a barrel could add 3 to 4 basis points to monthly core inflation. Fed Chair Kevin Warsh told Congress on 14 July that the inflation surge of the past five years would become a thing of the past, and his tenure so far has been read as consistently hawkish.
Today’s bid across crypto owes something to oil easing back from Monday’s highs, after Iran indicated that negotiations with the US could still be pursued. The Federal Open Market Committee (FOMC) meets on 28 and 29 July, with core PCE due beforehand.
The selling has stopped, the buying hasn’t really started
US spot Bitcoin ETFs have posted five consecutive sessions of net inflows between 14 and 20 July, totalling $727m. Monday’s $226.8m was the largest single day since early May, and two positive weeks have now followed an eight-week run of redemptions.
Set against the preceding two months, the scale is small. Between 7 May and 30 June these funds shed roughly $8.6bn, with May finishing at about negative $2.4bn and June at negative $4.5bn, the worst month on record for the category. July has brought back around $427m, close to 5% of what left.
The last period of sustained buying makes the same point. April drew in roughly $2.0bn, and the first four sessions of May added $1.68bn between them, more than double the current five-day run in a shorter space of time.
The composition has changed as cleanly as the direction. BlackRock’s IBIT drove most of the selling, with net redemptions of $448m on 18 May, $528m on 27 May and $445m on 26 June. It’s now driving most of the buying, contributing $389.6m of the first $500m of this run. Year-to-date flows across the category remain negative at about $5.2bn.
That’s a market where the pressure has come off rather than one where demand has returned. Flows going quiet could mean sellers are largely done, or it could mean buyers haven’t arrived in size and there’s nobody left to force a move in either direction. Flow data is sourced from Farside Investors.
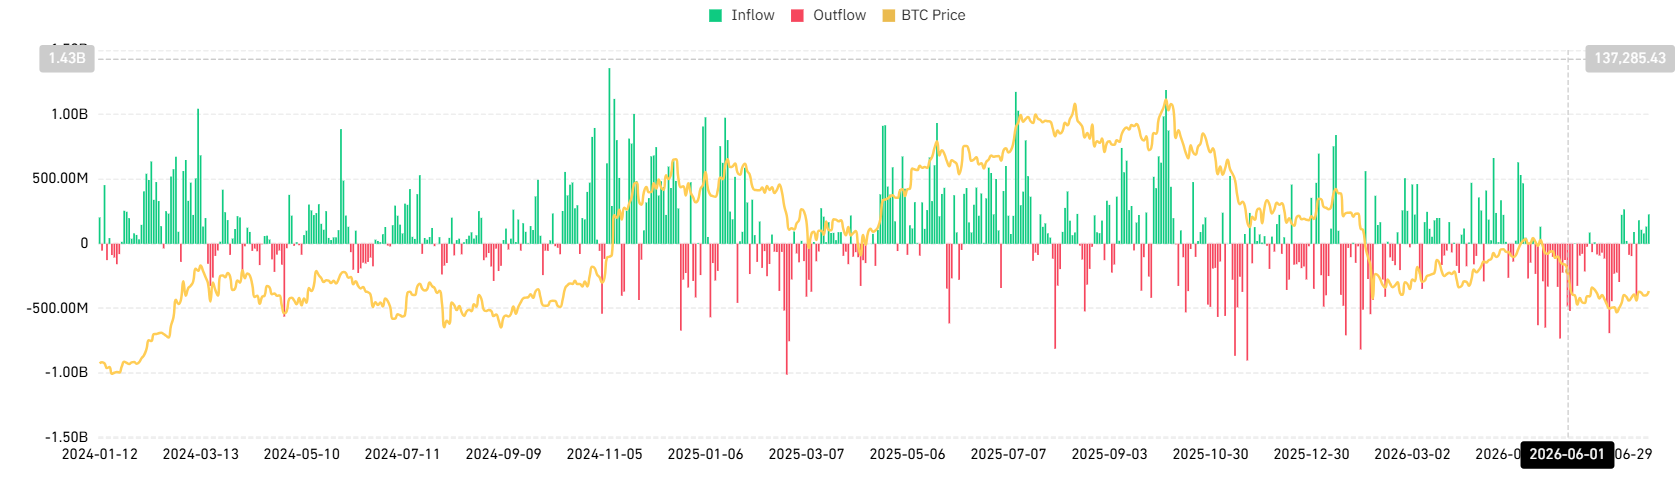
Daily net inflows and outflows for US spot Bitcoin ETFs since January 2024, shown against the Bitcoin price.
The daily chart
In our previous coverage of Bitcoin last week, price was rejected at this same zone. On the daily we see price reclaiming the 66,000 level and, at the time of writing, sitting at the very highs of this resistance zone.
Looking at the vertical volume bars at the bottom of the price chart, we see that yesterday’s candle carried higher volume than average, a possible sign that volume is confirming this breakout move. If buying volume picks up on this breakout, we might very well see continuation to the upside to the next resistance zone sitting at around 70,000.
Worth noting is the fact that price has now reclaimed the daily 50 EMA for the first time since losing it back in May this year. The accumulation/distribution indicator is in a steady uptrend, telling us that buyers are somewhat stronger than sellers here.
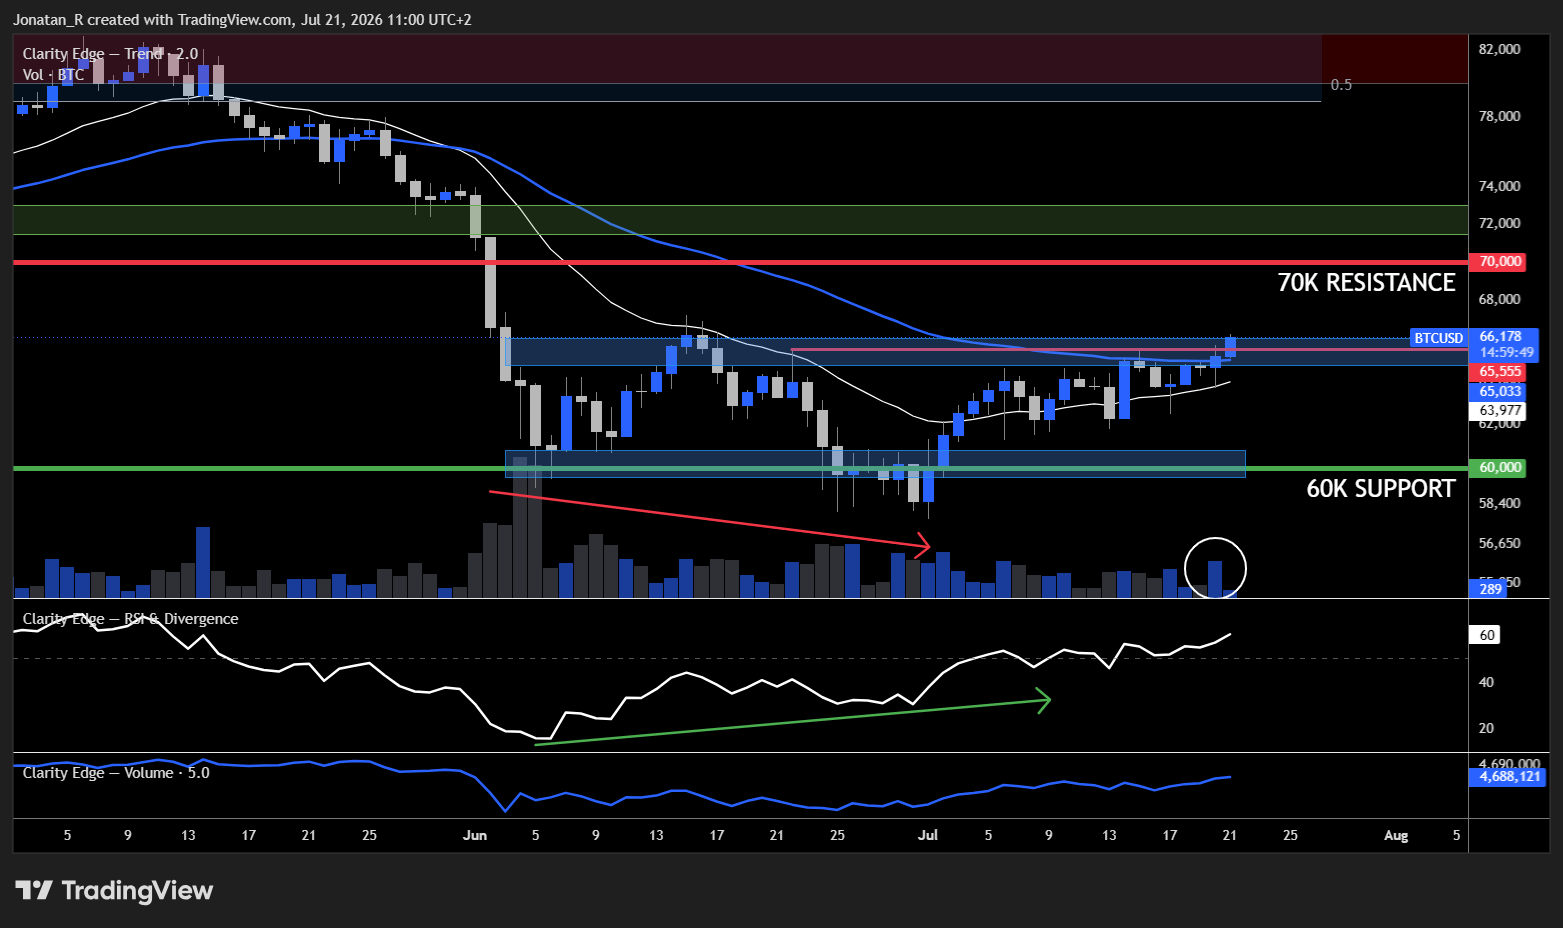
Bitcoin’s daily chart showing price reclaiming the 66,000 resistance zone, with 70,000 resistance above and 60,000 support below.
The 4H chart
Here we see a relatively strong trend with good volume yesterday on the test of this resistance. We can see on the accumulation/distribution indicator that we haven’t yet reached above the peak created on the test of resistance yesterday.
If we can get another volume spike today with a breakout on the accumulation/distribution indicator, we could see volume confirming price here, adding to the idea of this being a real breakout. If price pulls back from current levels, the closest low-timeframe level sits at 65,555.
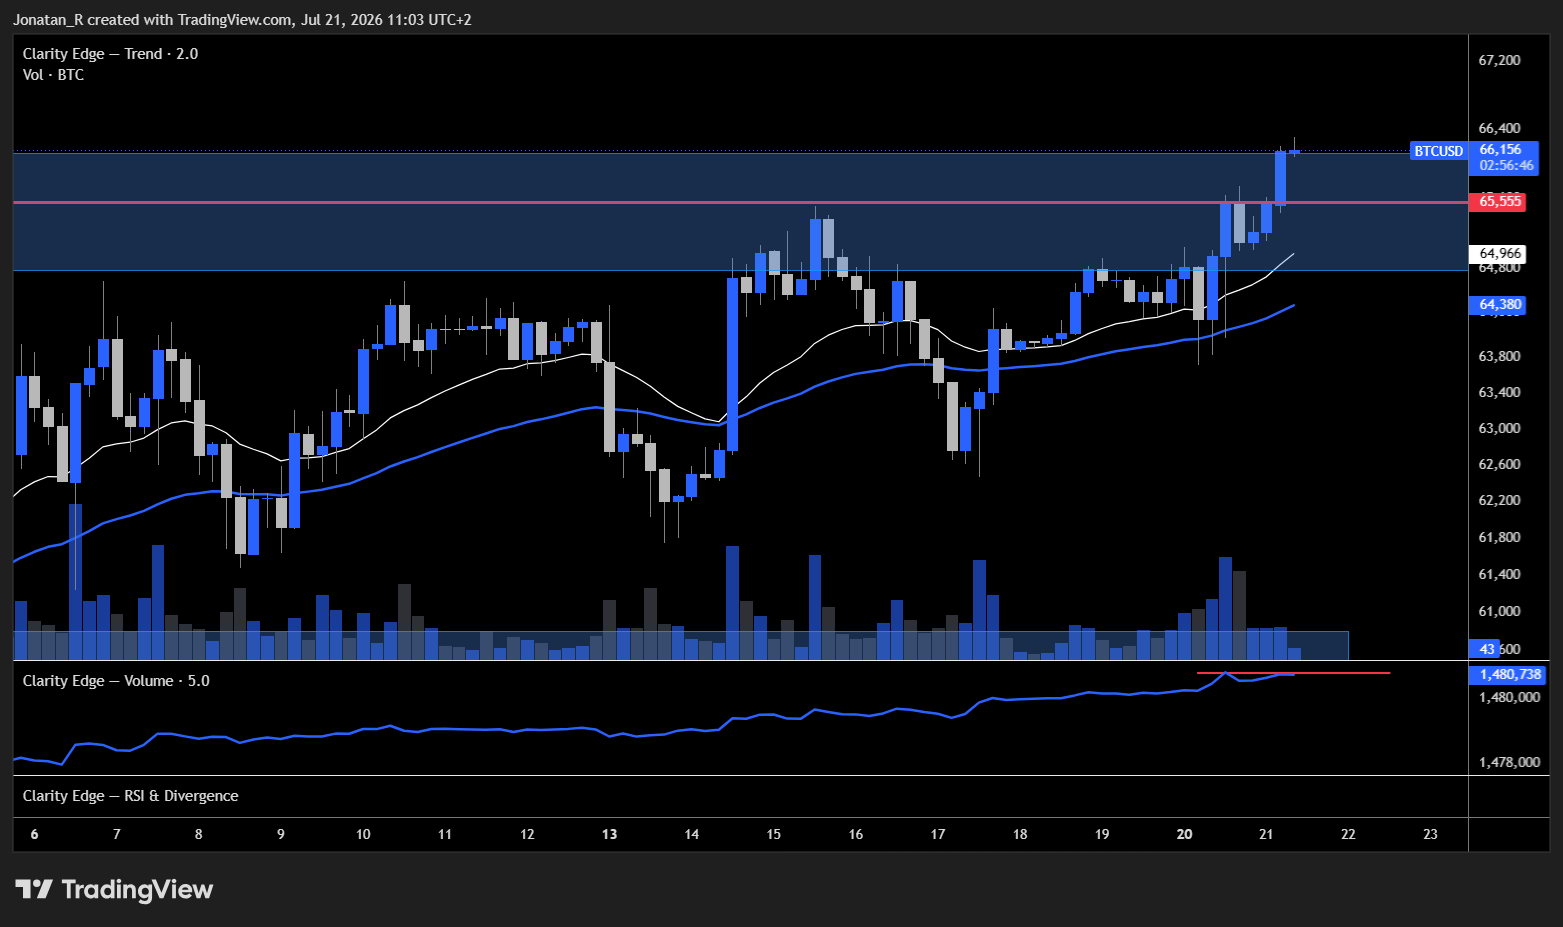
Bitcoin’s four-hour chart showing price pushing through the resistance zone, with 65,555 as the nearest level beneath.
Key levels to watch
- 66,000: the resistance zone that has capped price all month, now reclaimed with price at the highs of the zone
- 70,000: the next resistance zone above if buying volume confirms the breakout
- Daily 50 EMA: reclaimed for the first time since May
- 65,555: the closest low-timeframe level if price pulls back
- 60,000: the support zone below
Trading involves risk.
Author



 Risk Disclaimer
The content provided here is for informational purposes only. It is not intended as personal investment advice and does not constitute a solicitation or invitation to engage in any financial transactions, investments, or related activities. Past performance is not a reliable indicator of future results.
The financial products offered by the Company are complex and come with a high risk of losing money rapidly due to leverage. These products may not be suitable for all investors. Before engaging, you should consider whether you understand how these leveraged products work and whether you can afford the high risk of losing your money.
The Company does not accept clients from the Restricted Jurisdictions as indicated in our website/ T&C. Some services or products may not be available in your jurisdiction.
The applicable legal entity and its respective products and services depend on the client’s country of residence and the entity with which the client has established a contractual relationship during registration.