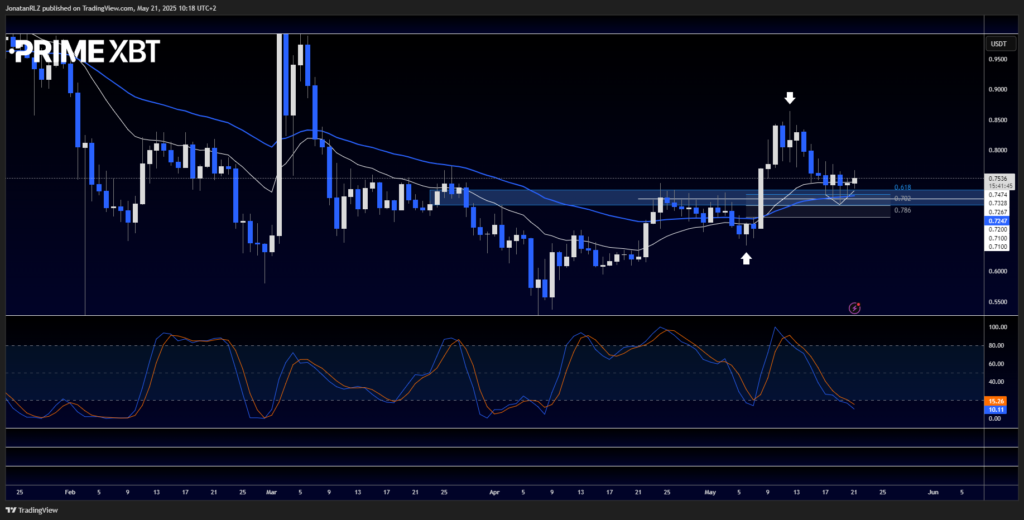
We are currently seeing some interesting movements across the crypto market, and one pair in particular that stands out is ADA. The coin recently retested a key support area marked on the daily chart around 0.72. Notably, when connecting the wicks of this retest with trendlines, we see a distinct V-shape, indicating a potential bottom formation. This kind of structure typically signals a break of market structure on the lower time frames.
The retest occurred right on the daily 50 EMA, marked as a blue line on the chart. Since then, ADA has been reclaiming the 20 EMA, marked as a white line, adding strength to the current bounce. We also find solid confluence in this area when applying the Fibonacci retracement tool, anchored from the low marked with a white up arrow to the high marked with a white down arrow. This provides a reliable support zone, adding to the technical significance of the recent move.
In addition, the daily Stochastic RSI is currently in oversold territory. A bullish crossover between the blue and orange signal lines, known as a bull cross, would further support the bullish outlook.

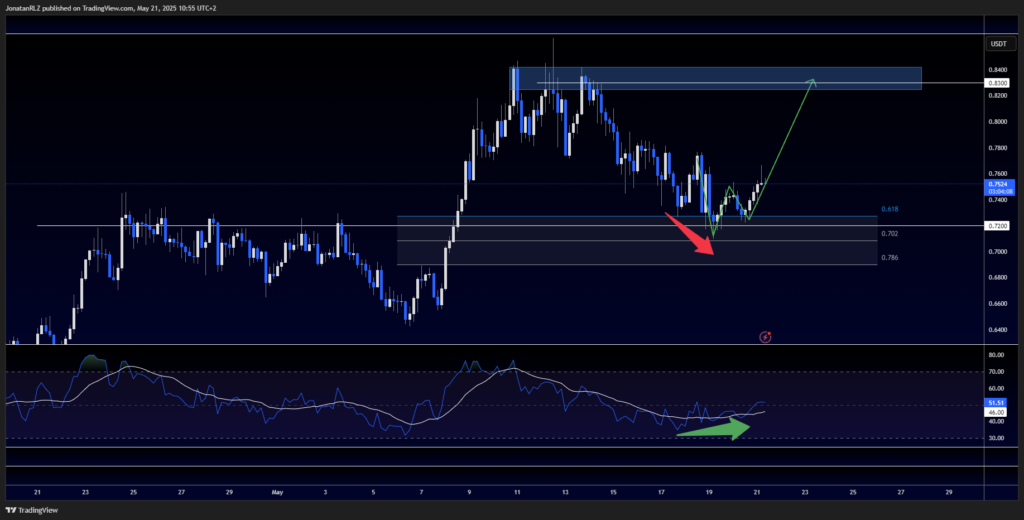
Shifting to the 4-hour chart, we can see a textbook break of structure, highlighted with green trendlines. As noted earlier on the daily, a V-shaped recovery typically leads to a break of structure on lower time frames, and that is precisely what we are seeing now on ADA. We now have a new higher low and a new higher high.
It is also worth highlighting the bullish divergence observed prior to the breakout. As shown by the red down arrow on price action and the green up arrow on the RSI, price was making lower lows while the RSI was making higher lows. When a high time frame retest aligns with confluence from horizontal support, moving averages, and Fibonacci levels, and is followed by a bullish divergence on the lower time frames, this adds weight to the potential for a trend reversal.
If this indeed marks the bottom for ADA, the next level to watch is 0.83, noted as the FTDA or First Trouble Area. This is the point where price is likely to face its first resistance on the way up. Whether or not ADA can push through this zone will help determine the strength and sustainability of this potential reversal.
Trade ADA
Trading involves risk.
The content provided here is for informational purposes only. It is not intended as personal investment advice and does not constitute a solicitation or invitation to engage in any financial transactions, investments, or related activities. Past performance is not a reliable indicator of future results.
The financial products offered by the Company are complex and come with a high risk of losing money rapidly due to leverage. These products may not be suitable for all investors. Before engaging, you should consider whether you understand how these leveraged products work and whether you can afford the high risk of losing your money.
The Company does not accept clients from the Restricted Jurisdictions as indicated in our website/ T&C. Some services or products may not be available in your jurisdiction.
The applicable legal entity and its respective products and services depend on the client’s country of residence and the entity with which the client has established a contractual relationship during registration.


