Fractal analysis is a powerful technical analysis approach used to identify turning points and make profitable trades. This guide will provide an overview of fractals and how to use them in developing strategies across timeframes.
Key takeways
- Fractals are self-similar recurring patterns used to identify potential turning points
- Bullish/bearish fractals form with 5-bar high/low criteria
- They identify potential trend reversals for trades
The fractal nature of financial markets
Fractals reflect the recurring pattern that emerges across different time horizons in the markets. This fractal concept in technical analysis draws from a branch of mathematics studying self-similar structures like coastlines, trees, rivers, etc. These mathematical patterns appear all over nature.
The fractal wave principle recognises that markets exhibit similar crowd behavior tendencies over both very long-term and very short-term time frames. In other words, the same mass psychological dynamics unfold but simply manifest on different scales or degrees. This is because many traders are participating in the market based on the same information and emotions.
For example, extreme sentiment drives bubble-style buying frenzies during bull markets across yearly, monthly and even 5-minute time horizons before reaching saturation. The peaks and troughs formed have similar technical characteristics. Greed and fear emerge to perpetuate boom-bust cycles across multiple wave degrees.
Master technical analysts realize that tracking real-time 5-minute Elliott Waves or hourly RSI patterns is no different to longer-term analysis in terms of the underlying human emotions driving prices. Indicator readings and pattern breakouts response remains consistent.
Because the fractal self-similarity preserves throughout time scales, astute traders combine multiple time frame analysis to identify repeating chart patterns for high-probability setups. The art lies in detecting repeating formations early as they emerge across degrees.
Thus from a trading psychology perspective, the fractal wave principle demonstrates that markets essentially exhibit the same characteristics of herd behavior continuously whether on 1-minute or 10-year charts.
What are fractals in technical analysis?
In trading, the fractal candlestick pattern can help identify potential reversal points in the market. Bullish and bearish fractals
https://www.investopedia.com/articles/trading/06/fractals.asp
form when five consecutive bars meet specific high/low criteria, indicating possible bounces. When fractals occur, it is imperative to combine with other technical indicators.

Types of fractal patterns and their usage
Fractal reversal patterns
Using the fractal pattern effectively can lead to better ROI and risk management. These classical 5-bar reversal patterns indicate possible turning points and bounces where the market is expected to reverse.
Here is the key to identifying patterns correctly when a fractal appears:
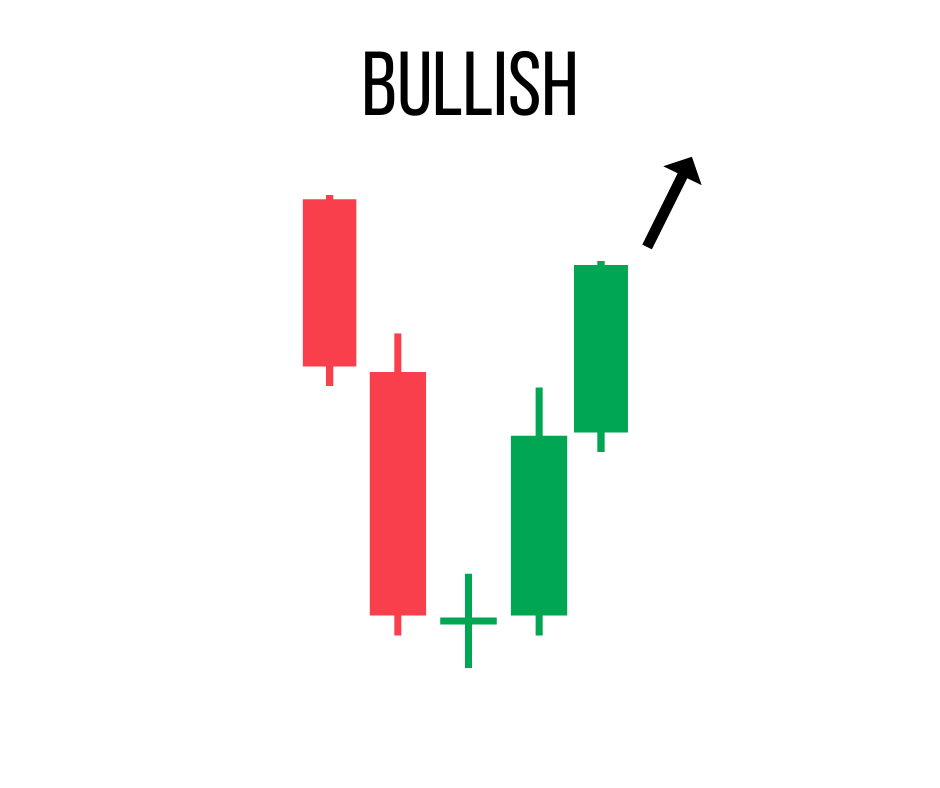
A bullish fractal forms with the middle 3 bars printing lower highs, and then the 5th bar closes above their highest high.
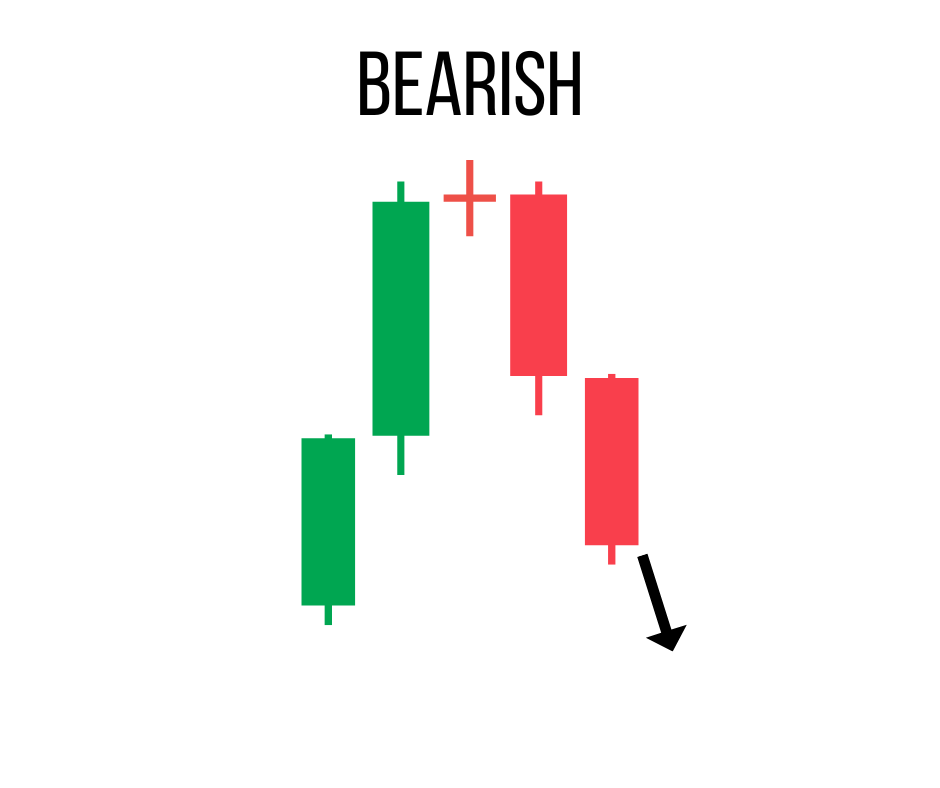
A bearish fractal occurs when the middle 3 bars make higher lows, and the 5th bar closes below their lowest low. Skilled traders recognize these patterns early and use them to anticipate imminent reversals and plan an entry point.
Multiple time frame analysis
One of the key strengths of fractal analysis is its applicability across multiple time frames. Traders can combine fractal signals on higher and lower time frames to improve the likelihood of accurate reversal detection.
For example, the emergence of a bullish fractal on the daily chart can be used by traders to identify bottoming formations and potential long entry points. However, for finer precision, traders can drill down to check if bullish fractals are also forming on the 4-hour or hourly charts.
The alignment of daily bullish fractals with lower time frame bullish fractals provides high-probability bottom fishing setups with tightly defined risk management. Traders then have increased confidence to enter long positions on the ensuing upward price bounce.
Conversely, bearish reversals are indicated when daily bearish fractals form in conjunction with bearish fractals on lower timeframes. The confluence of fractal reversal signals across time horizons produces extremely robust shorting opportunities.
Multi-timeframe fractal analysis filtering provides superior trade entry precision. Traders are able to define trades with excellent risk/reward prospects.

Fractal indicators and their configuration
While many traders can manually identify fractals on a price chart, using indicators can automatically plot these key levels and improve signaling. When using fractals, considering pairing any fractal indicators with other technical analysis tools and price patterns. Popular trading platforms like PrimeXBT have built-in technical analysis tools.
Fractal indicator settings
The most common fractal indicator settings include:
Number of periods
The standard is 5 bars, but traders can experiment with more bars for potentially deeper turning points.
Offset pips
An offset from the high/low allows some price penetration before a fractal break. Typical values are 2-5 pips.
Fractal colours
Differing colours clearly distinguish bullish and bearish fractals (e.g. green/red).
Fractals indicator customisation
Traders can customise the fractals indicator code to suit their preferences:
Alert triggers
Program alerts when new fractals form or when price closes above/below levels.
Multiple timeframes
Create fractal indicators to show daily/weekly fractals on intraday charts for improved analysis.
Auto-chart markers
Automate chart price pattern labels, horizontal lines, or arrow markers at key fractals.
Strategy enhancements
Fractal indicator outputs can be combined with other analysis methods:
Divergences
Fractal extremes combined with momentum divergence signals.
Breakout detection
Script breakout code off fractal levels for automated strategy triggers.
Pattern recognition
Identify and benefit from repetitive price behavior at fractal points.
The right indicators and customisations provide a solid foundation for robust fractal trading techniques.
Fractal trading strategies
Fractals define key areas of supply and demand in the market. A fractal trading strategy aims to enter positions as price bounces off these defined levels.
Breakout strategy
This long/short strategy looks to enter when prices break above or below the high or low following fractal signals:
- Identify bullish or bearish 5-bar fractal
- Wait for price close above/below the fractal high/low
- Enter breakout on next bar open with stop loss below/above opposite fractal
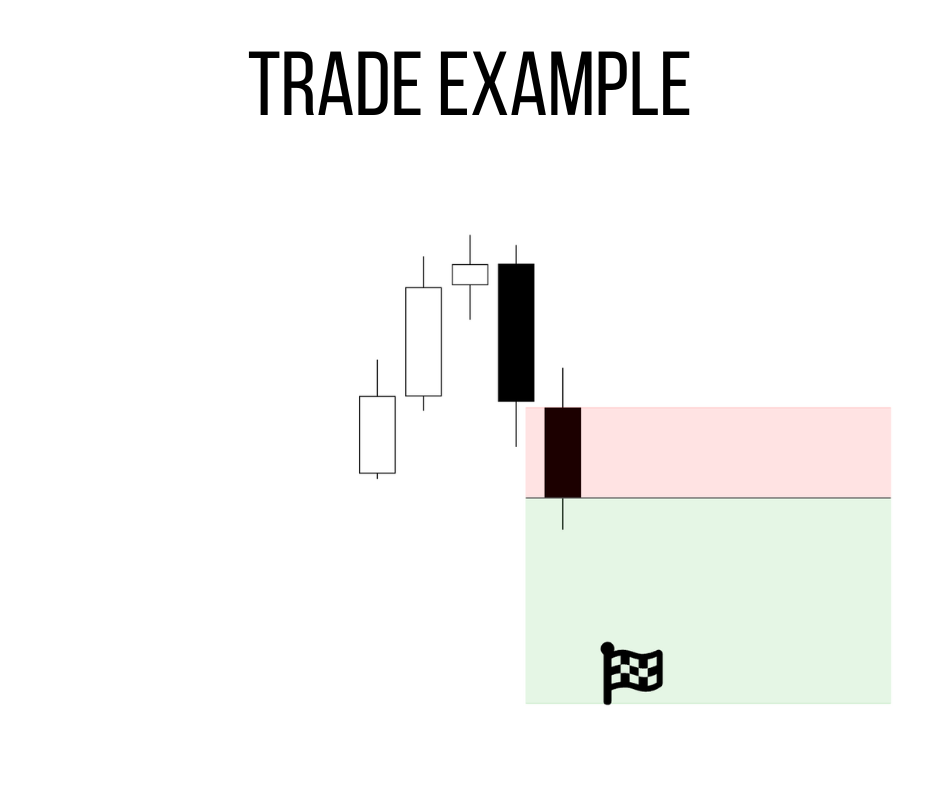
For example, after spotting a bullish fractal, traders would buy the break above its high. Stops are placed below the low of any bearish fractals nearby.
Reversal fading strategy
An alternate counter-trend approach fades the fractal direction, expecting retracements:
- Identify new fractal and wait for 1-2 bars of price movement away from fractal
- Enter reverse position back towards recent fractal
- Run with tight stop, targeting 3-5 times risk
This strategy aims to profit from failed breakouts and reversions back to recently broken fractal levels that may now act as support/resistance.
Optimisation techniques
To enhance strategies, traders can fine-tune entry rules, combine with supportive indicators, or focus on high probability chart/sentiment contexts for signal confirmation.
There are many possibilities to boost fractal strategy effectiveness via robust optimization techniques.

Risk management and stop loss placement
Fractals provide clearly defined highs and lows that lend themselves perfectly to implementing comprehensive risk and trade management techniques.
Setting stop losses
Tight stops are placed 2-5 ticks above bullish fractal highs or below bearish fractal lows to allow minor price movement. Wider 15-25 tick stops enable greater room for volatility while still marking defined risk points.
Trailing stops
As trades move in the intended direction, fractals allow traders to accurately trail stops. For example, as price advances after buying near bullish fractals, stops can be trailed under newer bullish fractals or prior swing lows.
Determining position size
The exact stop loss points provided by fractals allow traders to appropriately calculate position size based on proper risk management rules for their accounts. This ensures adequate risk controls.
Establishing correction targets
Fractal levels present clear areas that countertrend corrections may retrace to. Traders often take partial profits when price hits previous fractal zones. For example, after buying near bullish fractals, partial profits can be extracted if the market corrects back to test the fractal highs as potential new support.
Forecasting breakout targets
The exact high and low points of fractals allow traders to forecast potential breakout targets. By taking measurements from recent fractal swing highs to lows, the vertical distance estimates the minimum upside/downside price targets on sustained breaks.
Advantages and limitations of fractal trading
While the fractal pattern offers distinct benefits, traders should also understand inherent limitations in order to best apply strategies.
Advantages
Fractals provide key advantages:
Effective reversal detection
Early identification of potential trend changes aids preparation.
Visibility across timeframes
Multi-timeframe confluence provides precision.
Defined trade locations
Entry, stop loss and take profit levels are clear.
Versatility
Fractals adapt to diverse markets and trading styles.
Objectivity
Strategies rely on concrete price action rather than subjective indicators.
Limitations
However, the following restrictions should be noted:
Prone to false signals
Not all fractal reversals eventuate into lasting trend changes. Broken fractals can stop out positions.
Limited profit potential
Strict stops based on recent highs/lows cap upside potential.
Cluster occurrence
Multiple overlapping fractals at turning points can obscure analysis.
Lagging indicator
Fractals identify reversals only after market movement.
Mitigating limitations
Despite drawbacks, traders can apply tactics to improve fractal strategy outcomes:
Signal filtering
Combine with supportive indicators to isolate high-conviction moves likely to reverse and trend.
Pattern context analysis
Focus on entering trades only within chart formations exhibiting momentum change potential.
Breakout targets
Set larger targets based on measured moves rather than recent fractal levels alone to capture greater upside.
With proper utilisation, fractals remain highly valuable as part of a complete trading plan incorporating robust risk management protocols tailored to individual trading style and risk tolerance.
Conclusion
Fractal pattern analysis provides objective entry and stop loss positioning for reversal trades even for discretionary traders. By combining fractal signals across multiple timeframes, traders can develop robust strategies with predefined risk management for varied market conditions. Use confirmed high-probability setups.
What is a fractal in trading?
A fractal is a five-bar reversal pattern that signals potential trend changes in price action analysis.
Does the fractal trading system really work?
Fractal strategies can be profitable when applied selectively at confirmed reversal points and with good risk/reward ratios. Proper trading rules and risk management are essential.
What is the best indicator to use with fractals?
Common indicators to add confirmation include RSI, volume, moving averages crosses, and other oscillators.
The content provided here is for informational purposes only. It is not intended as personal investment advice and does not constitute a solicitation or invitation to engage in any financial transactions, investments, or related activities. Past performance is not a reliable indicator of future results.
The financial products offered by the Company are complex and come with a high risk of losing money rapidly due to leverage. These products may not be suitable for all investors. Before engaging, you should consider whether you understand how these leveraged products work and whether you can afford the high risk of losing your money.
The Company does not accept clients from the Restricted Jurisdictions as indicated in our website/ T&C. Some services or products may not be available in your jurisdiction.
The applicable legal entity and its respective products and services depend on the client’s country of residence and the entity with which the client has established a contractual relationship during registration.


