The bullish engulfing pattern needs to form a gap even to happen, so in some markets like crypto, we improvise. The bullish engulfing candle is a candle that many people pay close attention to, and therefore it can trigger much action.
What Is a Bullish Engulfing Candle?
The bullish engulfing candle is a unique candle that people pay quite a bit of attention to. The candle suggests that the buying pressure is increasing, which is often a sign of a reversal or even a continuation of the bullish pressure. This candle is one that many traders will pay close attention to, but it needs a market that closes to appear.
Bullish Candlestick Formation
A bullish candlestick formation is a single candlestick with a lower gap at the open but then turns around to close outside the previous candle’s range. This means that the opening of the day or week was bearish, but things changed drastically during that session. By showing this complete reversal, the idea is that the bulls are taking over.
The sellers of both candles are losing money and will have to buy back their positions to cover their losses. The covering of the short positions will add pressure to an already bullish move. Think of the pattern when sellers are “trapped” in the market. The bullish candle shows that the tide is turning.
How to use the bullish engulfing pattern?
The bullish engulfing pattern is a pattern that has a straightforward situation. The market turned around and showed a lot of strength. When the pattern forms, it is a gap lower, only to turn around and rise above the high of the previous candle.
This means that the sellers are now losing money, and they are going to have to cover.
The market breaking above the top of the engulfing candle would be a sign that traders will be buying even more, and putting a stop loss order under the candle is a great place to protect yourself in the event of a failure. If that does end up being broken to the downside, that could be a sign that the buyers have suddenly lost all control. Sometimes, a failed pattern is a great signal to take a trade.
Example of the bullish engulfing pattern
Keep in mind that a bullish engulfing candlestick gaps lower, only to turn around and break higher than the previous one. The most apparent issue you will have trying to find when trading crypto or CFD markets will be that they do not close. In other words, getting accurate, engulfing candlesticks is extraordinarily rare.
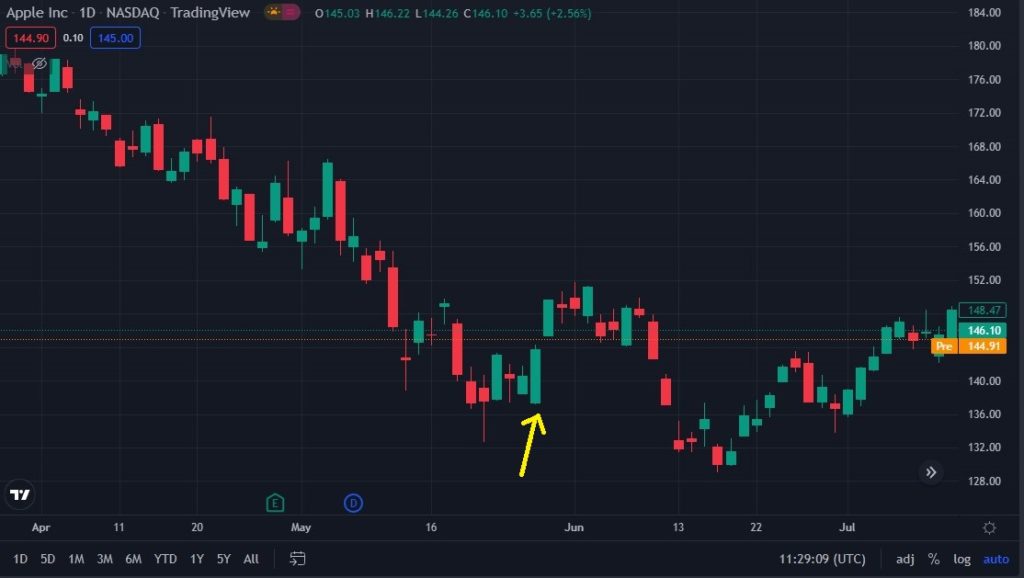
Because of this, we will look at two examples. The first one will be in the stock Apple, which closes at the end of each trading session in New York. You could see on the chart there is a candlestick highlighted that opens up lower than the previous day but then turns around and swallows that candlestick, kicking off a short-term recovery. This is the purest form of an engulfing candlestick.

A classic engulfing (bullish) candlestick in Apple. Tradingview.com
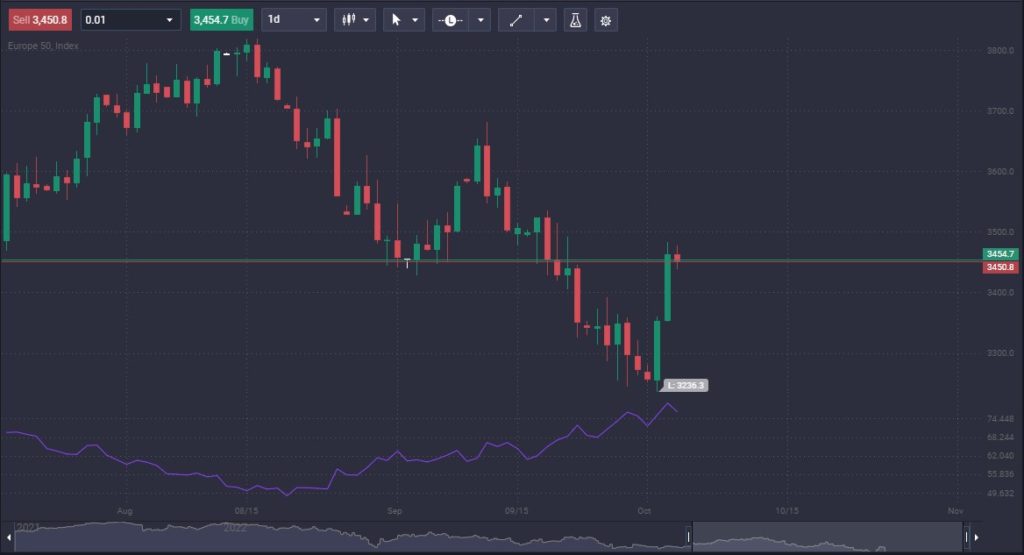
In the following example, it is EUR50 CFD. Because it is CFD, you don’t get the same type of gaps, at least not unless it is the very beginning of the week. In this example, you can see that a candlestick made the low at 3236, broke below the previous candlestick, and then shot straight up in the air, completely engulfing the last session. This is how you have to look at open markets 24/7 because you do not get the gaps. However, the message is still the same. You had seen a bit of selling pressure, followed by massive buying pressure. Sometimes, it’s essential to get the meaning of the candlestick instead of the same tick-for-tick action.

Bullish engulfing candle starts a rally in EUR50, PrimeXBT platform.
Bullish engulfing pattern vs. bearish engulfing pattern
The bullish and bearish engulfing candlestick patterns are the opposite of each other. In the case of the bullish engulfing candlestick, the candlestick starts by gapping lower. It then turns around and shoots higher. By the time the candlestick closes, it is above the range of the previous candlestick. It essentially is swallowing the first candlestick.
The idea is that the sellers are losing money from both candles. They need to buy back their shorts to cover losses. This adds more bullish pressure on the market. You are benefiting from other traders having to chase the market.
The bearish engulfing candlestick starts by gapping higher. However, the sellers jump in and start pressing the markets to the downside. The candlestick then breaks below the previous candle’s low, forcing all the buyers into losses. This will begin to feed on itself, and selling continues.
Limitations of using a bullish engulfing pattern
There are some limitations when it comes to using the bullish engulfing pattern. The biggest thing is that it can provide a false sense of certainty, as people tend to look for “perfection.” The reality is that according to Thomas Bulkowski, the success rate of the candlestick pattern is 63%, and although that is a positive rate of expectancy, it isn’t 100%.
As with any other trade setup, you will need to use money management to make things work out. By keeping your position size reasonable, you don’t run the risk of ruin due to overconfidence in the trade.
Advantages and Disadvantages of Trading the Engulfing Pattern
The advantages and disadvantages of trading the bullish engulfing pattern are varied, but there are a few primary considerations.
Advantages:
- Widely known as a bullish trade pattern
- Obvious and easily spotted
- Offers a straightforward entry and exit level.
Disadvantages:
- Some candles can be long, meaning stop-loss orders may be far away from the entry
- The traditional form doesn’t happen in markets that don’t close
- Is better thought of as an indicator of support working
Bullish Engulfing Pattern Trading Tips for Crypto
While the bullish engulfing pattern doesn’t technically happen in a market that is open 24/7/365, the needs can sometimes give you a similar setup if you know what to look for. Furthermore, you have to be able to read what the “candlestick is trying to say,” as there is a little bit of artistry involved.
Tip #1 – Recognize an “engulfing candlestick in crypto.”
Understand that the crypto markets do not close. Because of this, there is no way for a daily candlestick to “gap lower.” However, if you find that a candlestick plunges below the previous candlestick and then turns around to close above it – it means the same thing, minus the gap.
Tip #2 – Find support
Always trade these candlesticks from a support level. After all, a simple candlestick is not enough of a reason to put money at risk. After all, there should be a reason for the market to make a move. The support level is an area where many people will be looking to get involved.
Support and resistance are 2 of the most common ways to trade the market, so if you find this candlestick at a support level, it makes sense that there should be plenty of other people following right along. Remember, the more obvious, the better.
Tip #3 – Set stop loss at the bottom of the candle. Make the market prove you wrong.
Setting a stop loss at the bottom of the candlestick makes the market prove you wrong. The other thing to think about is entries. You may wish to enter when the market breaks above the engulfing candlestick. The great thing about the engulfing candlestick is that there is a lot of effort in that candlestick to make it happen; therefore, it will take a lot of effort to break it back down.
Conclusion
In conclusion, this is a pattern that you should be familiar with. After all, there is a positive expectancy with this pattern, and it follows that there is a significant amount of interest in trading it. After all, it is something that many traders are familiar with, and in the end, it works out more than it doesn’t. However, that is no reason to get aggressive just because the pattern kicks off.
The most important thing to consider is that the part itself isn’t the “be all, end all” of the trade. The most important thing is ensuring the trade lines up with other factors. For example, does it signal a continuation of a longer-term trend after a pullback? Is it sitting on a support level? Is another indicator giving you a potential buy signal, such as a moving average? The more, the merrier in this case.
Putting your stop-loss order under the candle allows the market to have to work hard to take you out. However, when it does, this is known as a “busted pattern,” which is a strong signal in the other direction.
Remember that anything with a positive expectancy, in this case, 63%, will make money in the long term. The question is whether or not you have the proper money management and psychology to let it play out. If you do, this should be a winning strategy, especially if it is married to the longer-term trend. Just because there is a positive expectancy does not mean you can throw money management out of the window. Make sure that you use a professional approach to this pattern, and you should anticipate success. Unfortunately, new traders tend to get far too aggressive based on a candlestick. It is a hint as to what the market may do, not a guarantee.
Most traders will buy a market on a break of the top of the candlestick and place a stop loss just below the bottom. You must also find another reason to take the trade, not just the candlestick pattern itself. Taking the trade for multiple reasons will increase your odds of success.
How reliable is a bullish engulfing candlestick?
According to Bukowski, widely considered a leading statistician of trading patterns, the bullish engulfing candlestick is successful 63% of the time. You can increase your potential success if you take this trade at support, a moving average, a trendline, or multiple other potential technical indicators.
Is engulfing candle bullish or bearish?
It can be either. The idea is that it “engulfs” the previous candlestick. If it rises, then it is bullish. If it falls, then it is bearish. Keep in mind that there needs to be a gap between the candles to form this pattern technically, but in 24/7/365 markets, it's more of a situation where you “fudge” the pattern and simply look for a candle that swallows the previous one in both directions.
How do trade bullish engulfing patterns?
Most traders will buy a market on a break of the top of the candlestick and place a stop loss just below the bottom. You must also find another reason to take the trade, not just the candlestick pattern itself. Taking the trade for multiple reasons will increase your odds of success.
The content provided here is for informational purposes only. It is not intended as personal investment advice and does not constitute a solicitation or invitation to engage in any financial transactions, investments, or related activities. Past performance is not a reliable indicator of future results.
The financial products offered by the Company are complex and come with a high risk of losing money rapidly due to leverage. These products may not be suitable for all investors. Before engaging, you should consider whether you understand how these leveraged products work and whether you can afford the high risk of losing your money.
The Company does not accept clients from the Restricted Jurisdictions as indicated in our website/ T&C. Some services or products may not be available in your jurisdiction.
The applicable legal entity and its respective products and services depend on the client’s country of residence and the entity with which the client has established a contractual relationship during registration.


