Traders and investors alike resort to performing technical analysis when studying the market to understand the current conditions and to predict the future market direction.
One of the most vital aspects of this analysis includes reading and understanding chart candlesticks and their pattern formations.
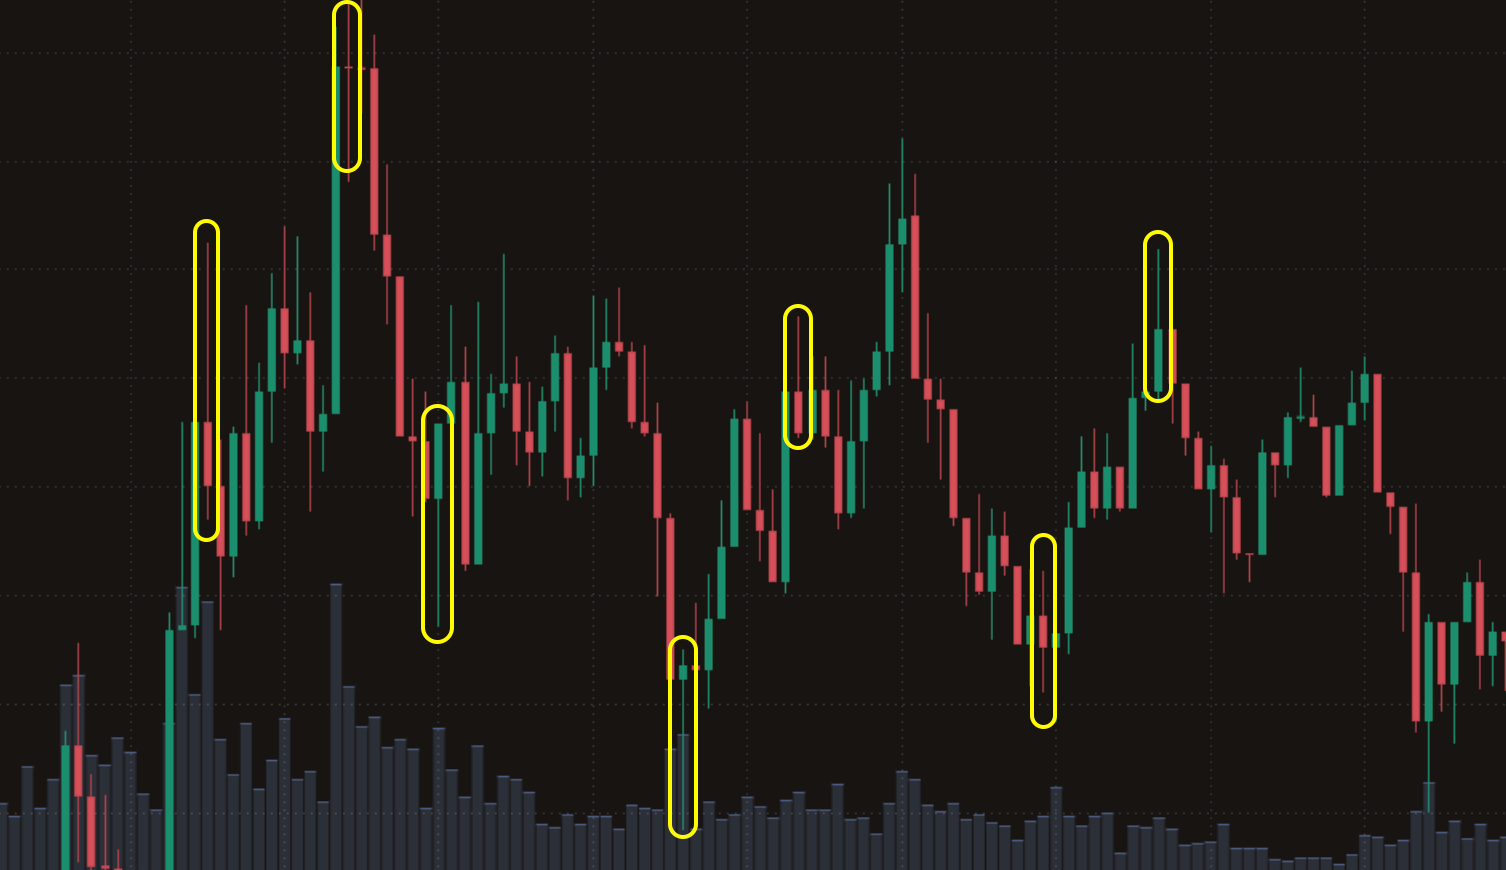
Candlesticks and their formations or patterns, serve as a visual representation of the price action of any trading asset on the chart.
The ability to identify different candlesticks and read the patterns they create allows traders to develop trading strategies that help improve their entry into the market.
What are long wick candles?
Definition and structure of long wick candles
A long wick candle is a reversal indicator that typically emerges in the opposite direction of the prevailing trend on the market.
Structure of such candles consists of the body and two shadows or upper and lower wicks:
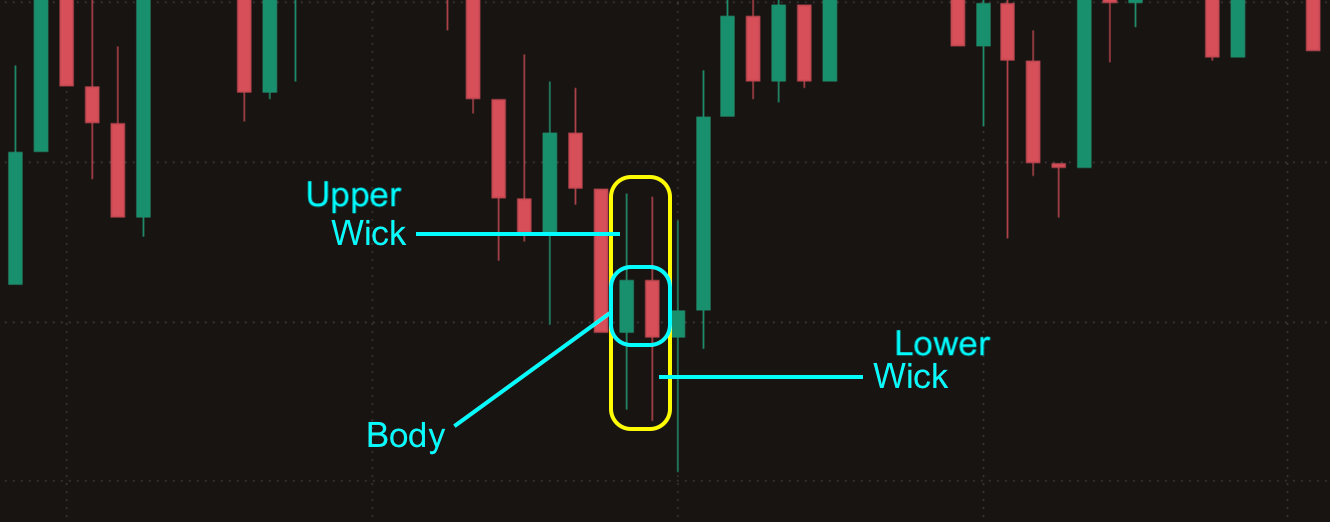
The wicks (shadows) of the long wick candlesticks represent the highest and the lowest price movements of the asset within a given time period.
Whereas the body of the candle itself reflects the difference between the opening and closing prices.
Long wick candlestick patterns, such as the Hammer or the Shooting Star have only one shadow (wick) either at the top or the bottom of the candle.
This depends on the type of reversal pattern they form; bullish or bearish.

Another interesting pattern of the long wick candle is the Spinning Top. What makes this type of candle special is the equal long wicks, and a short body in a shape of a cross.
The Spinning Top candlestick pattern forms a relevantly neutral pattern.
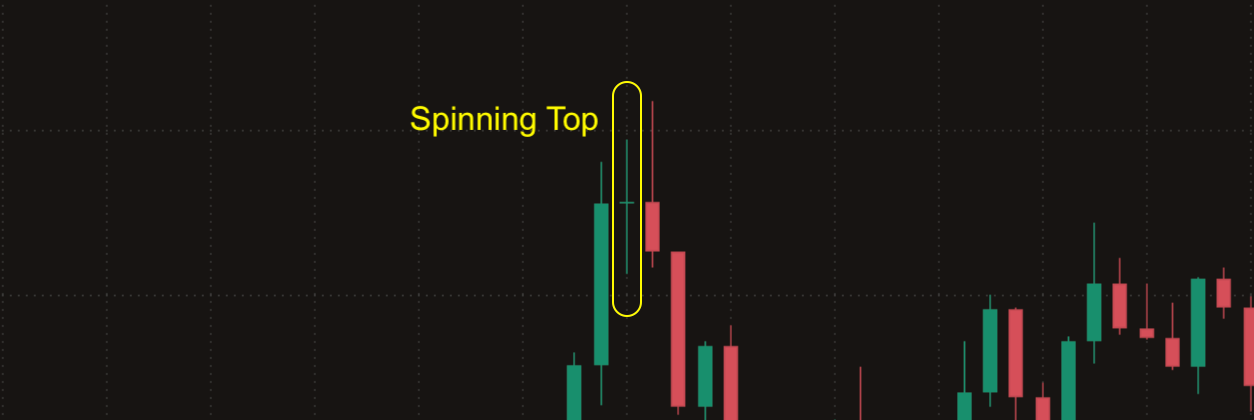
The three long wick candlestick patterns: Hammer, Shooting Star and Spinning Top, each represent and indicate three different types of trends; bullish, bearish and neutral, respectively.
Interpreting the colours and components of a long wick candle
Another important aspect of long wick candlesticks and any candles in general is their colour.
A classical chart pattern includes green and red candles that represent the difference between opening and closing prices.
Green candlesticks indicate that the closing price surpassed the opening price, whereas red candlesticks suggest that the closing price ended below the opening price, delineating the direction of the price movements for a specific time frame.
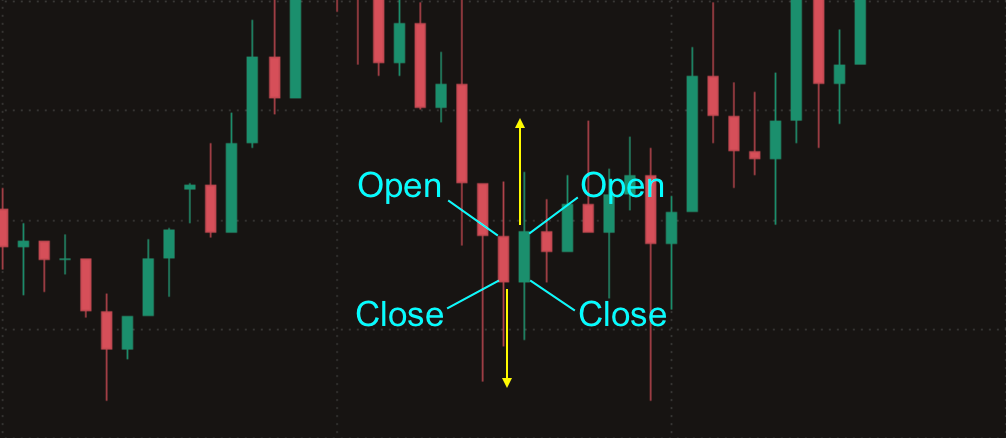
Apart from the opening and closing components of long wick candlesticks, which are employed to discern price variations, the length of the candle bodies and wicks also hold significance in comprehending the price dynamics of the asset.
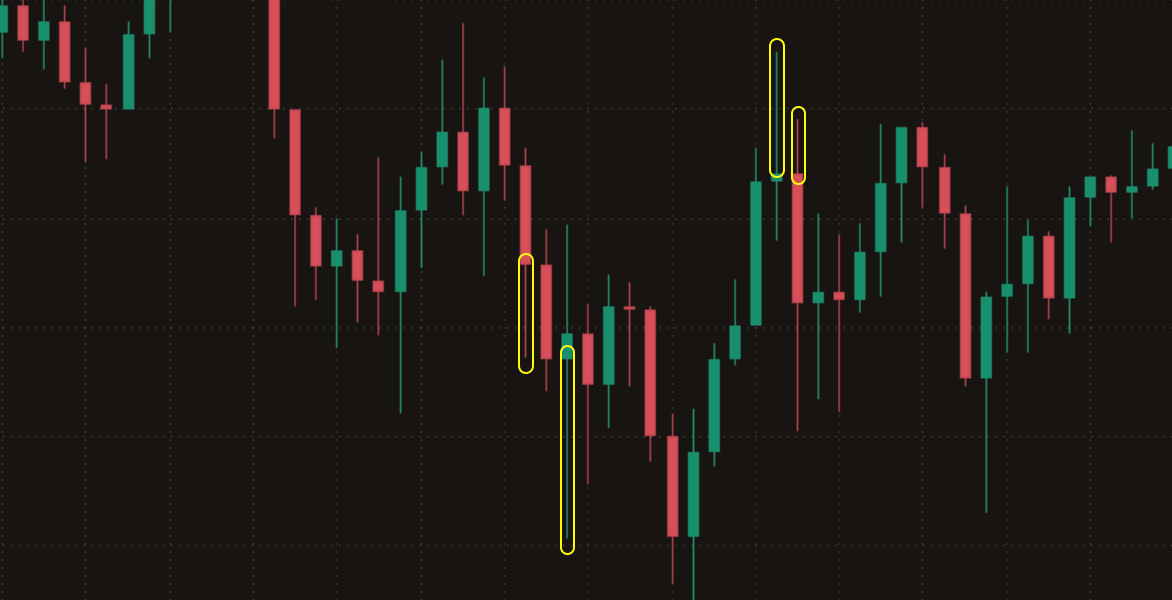
- Candles with a greater upper wick appear when the price of the asset advances in a bullish trend reaching for a high point, however closes at a lower price.This scenario typically takes place when the selling pressure overthrows the attempts of buyers to control the majority of the trading session.
- On the contrary, a long lower wick candle implies a different market situation.When the buying pressure during a trading session turns out to be greater, all dominating efforts of sellers driving the price in a downward trend fail.
In addition to this, the length of the candle body also provides fundamental data about the price movement of an asset.
Depending on the candle’s body length, traders can make informed decisions by evaluating the opening and closing prices of the trading session.
The significance of bullish and bearish long wick candlesticks
Bullish long wick candlestick
As the name implies, a bullish long wick candlestick pattern points to a potential reversal of the trend upwards.
Formation of a bullish long wick candle with a long lower wick is determined by the preceding price decrease upon the next open from the previous close.
A subsequent rally throughout the trading session with a close above the last open suggests that the buyers managed to withstand the downtrend and shift the sentiment.
This provides traders with a potential signal for a good entry into a long position.
Bearish long wick candlestick
The bearish long wick candlestick pattern is a reversal pattern that can be spotted by a long upper wick candle that represents the highest price of the asset during the trading session.
However, this formation displays that the last close for the price was lower than the open.
A selloff followed within this formation signals to a bearish prevailing trend which closes the session below the opening price.
Typically traders use this as an opportunity to enter the market with a short position, expecting a sustainable downtrend.
How to identify long wick candles on charts
An integral part of the process of identifying a long wick candle is the comparison with nearby candles.
The distinctive features of candles with noticeably longer wicks typically provide the necessary context to spot relevant patterns.

Nonetheless, in order to properly interpret a long wick candle, the support and resistance levels must also be evaluated.
While the support level provides the context of the lowest price of the asset, the resistance level helps understanding where the price action gradually slows down in a potential reversal.
Developing a long wick candlestick trading strategy
Any effective long wick candlestick trading strategy requires technical analysis in combination with proper risk management.
Best position entries and subsequent success can become feasible by following some of these basics:
Technical analysis
- The development of a sustainable trading strategy includes the ability and knowledge to identify and distinguish long wick candles from regular ones.
- Once a long wick candlestick has been identified, a following pattern must be spotted by studying the length of the wicks and size of the candle’s body.
- Moving forward a confirmation of the determined pattern must be evaluated by overviewing the general picture with the help of resistance or support levels.
- Any selected entry point will also depend on the assessment of the current market conditions, prevailing price trend, buying/selling pressures and overall market sentiment.
Risk management
- As with any other technique, a long wick trading strategy requires patience, proper evaluation of risk appetite and a clear step-by-step execution plan.
- The effectiveness of the chosen strategy must not rely solely on analysis but also on properly placed Take Profit and Stop Loss orders.Protective orders provide the opportunity to reduce the risks and reach better exit points if the chosen strategy does not completely fit current market conditions.
Combining long wick candles with other indicators
A great addition to any trading strategy with long wick candlesticks are technical indicators and tools. While the chart provides valuable data, it may be insufficient to acquire necessary trade confirmations.
Here are just a few that can well compliment the chosen strategy:
Selecting the right time frame. Trading long wick candlesticks could be challenging if the choice of chart time frame is random. Smaller time frames may be more suitable for day traders, while longer time frames may fit swing traders better.
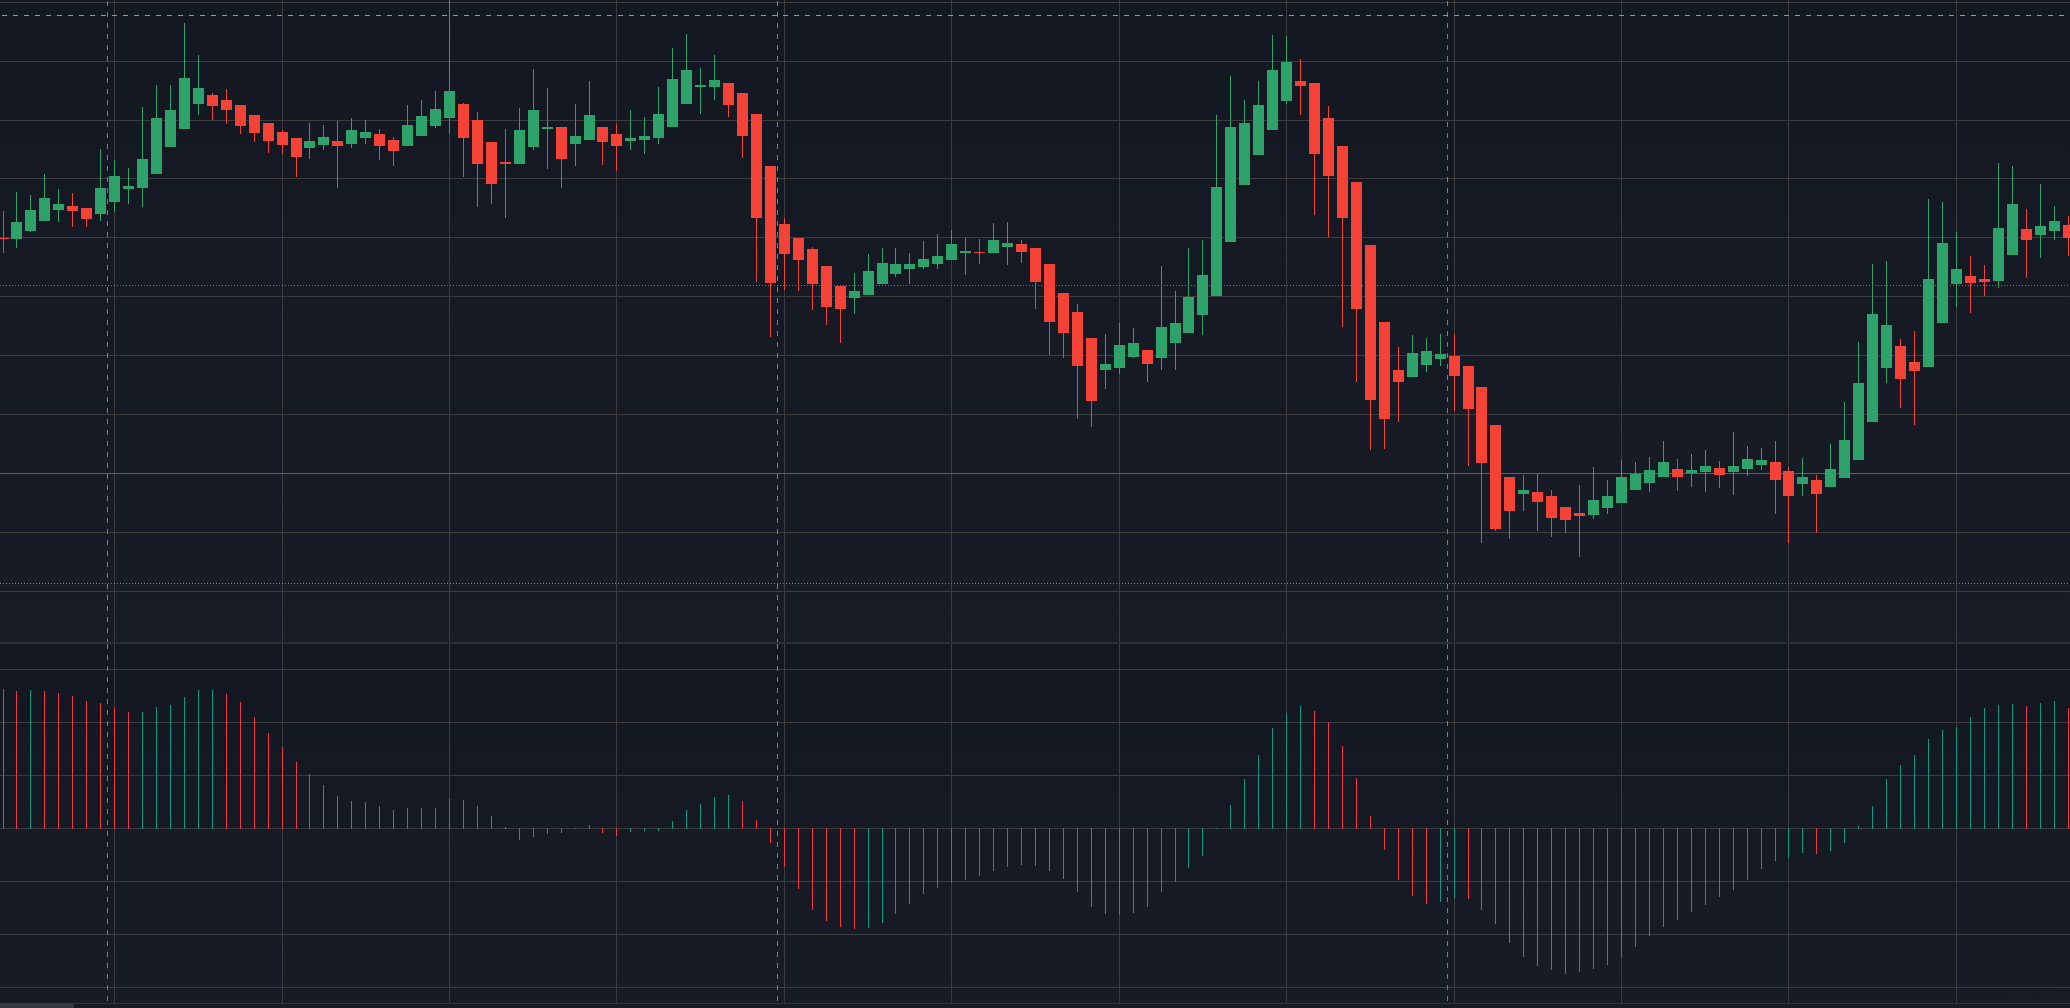
Heikin Ashi candlestick charts. This type of candlestick chart interface helps not only identify long wick candles but to also analyse the market trends. This is possible due to a more smooth representation of candles on the chart.
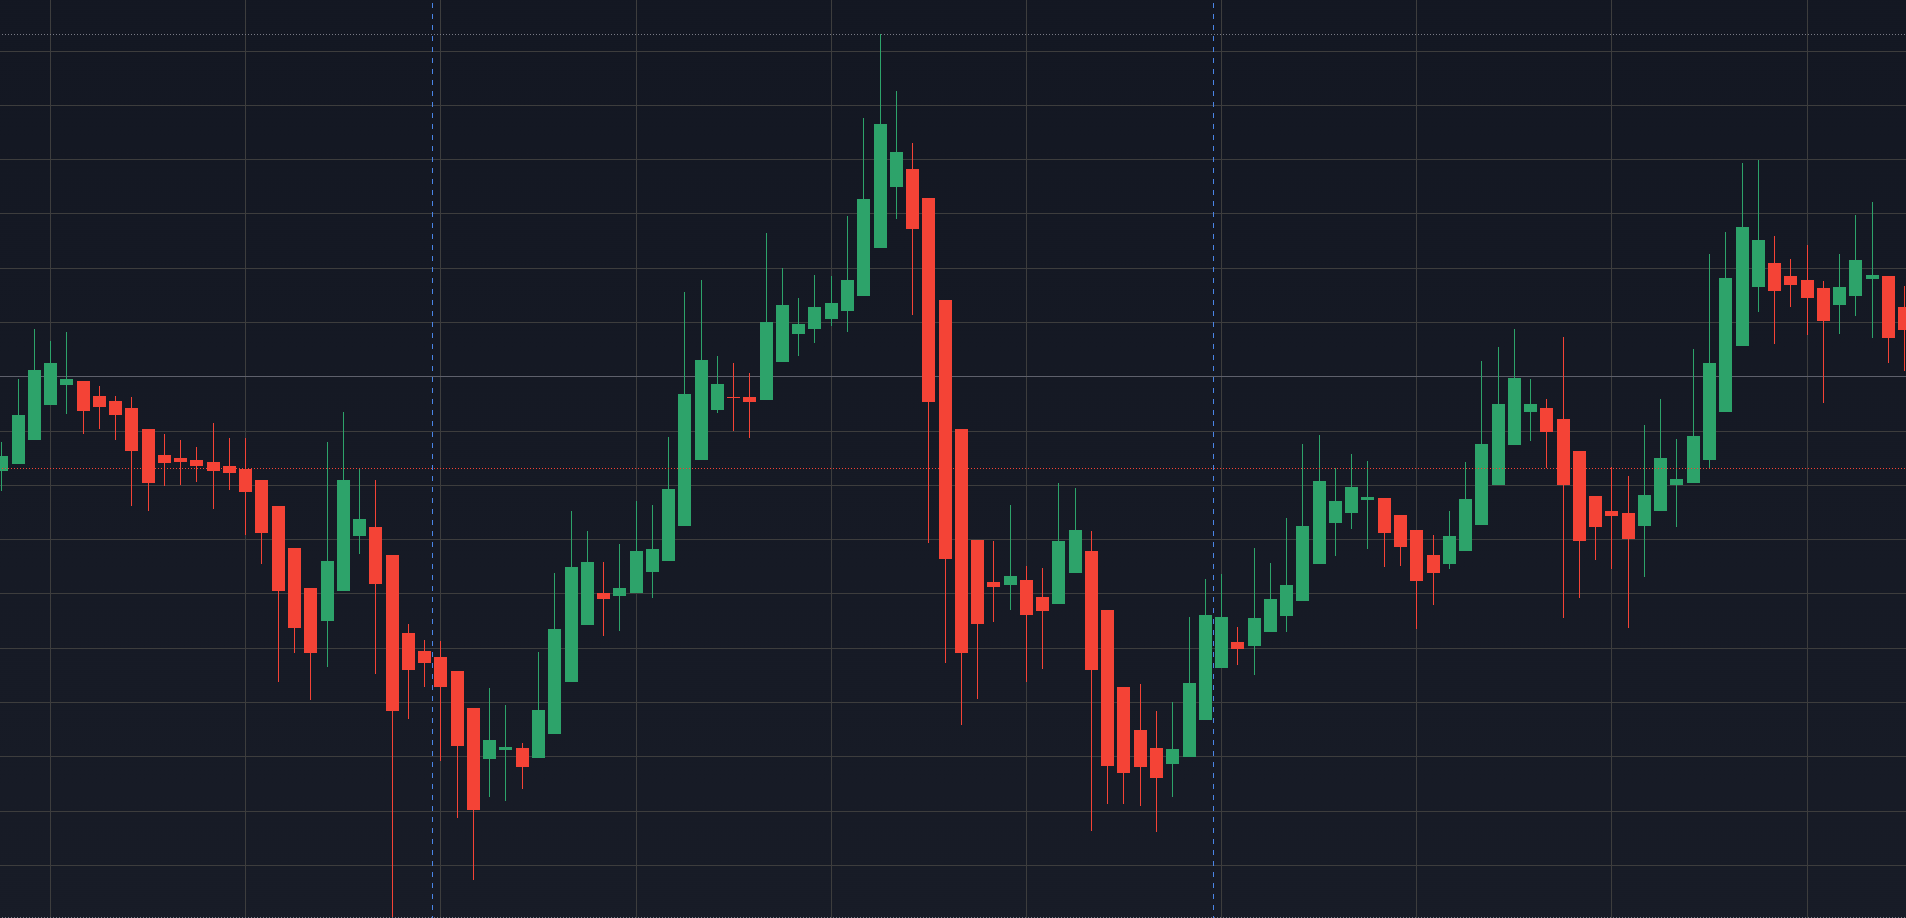
Trend Strength Index. Another great indicator that measures the strength of an asset or market’s price movement over time.
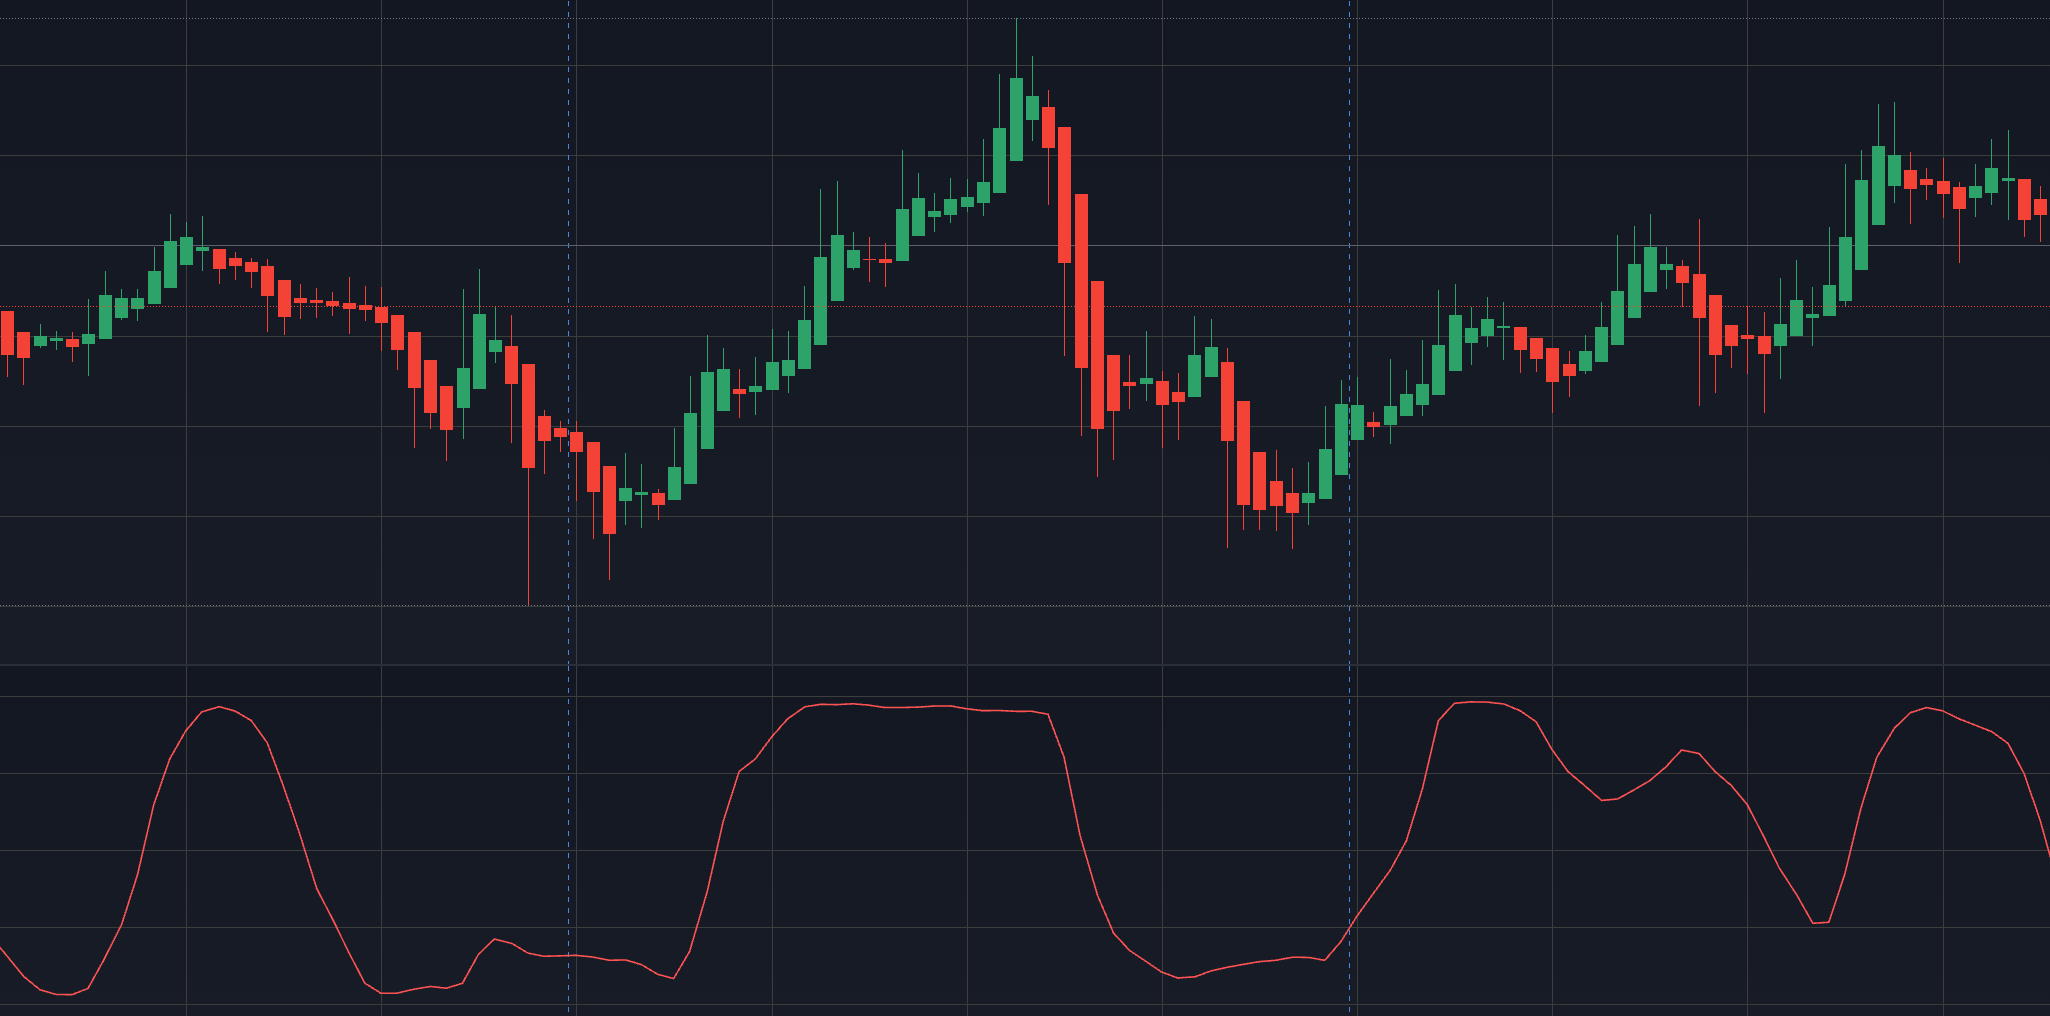
Balance of Power indicator. Some traders select this indicator to asses the balance between the buyers and sellers on the market, allowing them to understand the current trading pressures.
Conclusion
Long wick candles represent the price movement of an asset within a selected period of time.
These candles can form various patterns, depending on the length and the amount of their wicks and typically serve as an indicator of a specific price trend; bullish, bearish or neutral.
Both beginners and experienced traders resort to trading strategies with this type of technical chart analysis as it provides a simple yet comprehensive way to identify better trade entry and exit points.
However as with any other trading strategy regardless of it’s simplicity, risk management is key to achieving best results while protecting yourself from potential loses and unpredictable market action.
The content provided here is for informational purposes only. It is not intended as personal investment advice and does not constitute a solicitation or invitation to engage in any financial transactions, investments, or related activities. Past performance is not a reliable indicator of future results.
The financial products offered by the Company are complex and come with a high risk of losing money rapidly due to leverage. These products may not be suitable for all investors. Before engaging, you should consider whether you understand how these leveraged products work and whether you can afford the high risk of losing your money.
The Company does not accept clients from the Restricted Jurisdictions as indicated in our website/ T&C. Some services or products may not be available in your jurisdiction.
The applicable legal entity and its respective products and services depend on the client’s country of residence and the entity with which the client has established a contractual relationship during registration.


