Trading on the Cryptocurrency markets implies the utilisation of various chart patterns. Many of these patterns resemble letters from the alphabet, such as ‘M’ shaped tops or ‘U’, ‘V’, ‘W’ shaped bottoms.
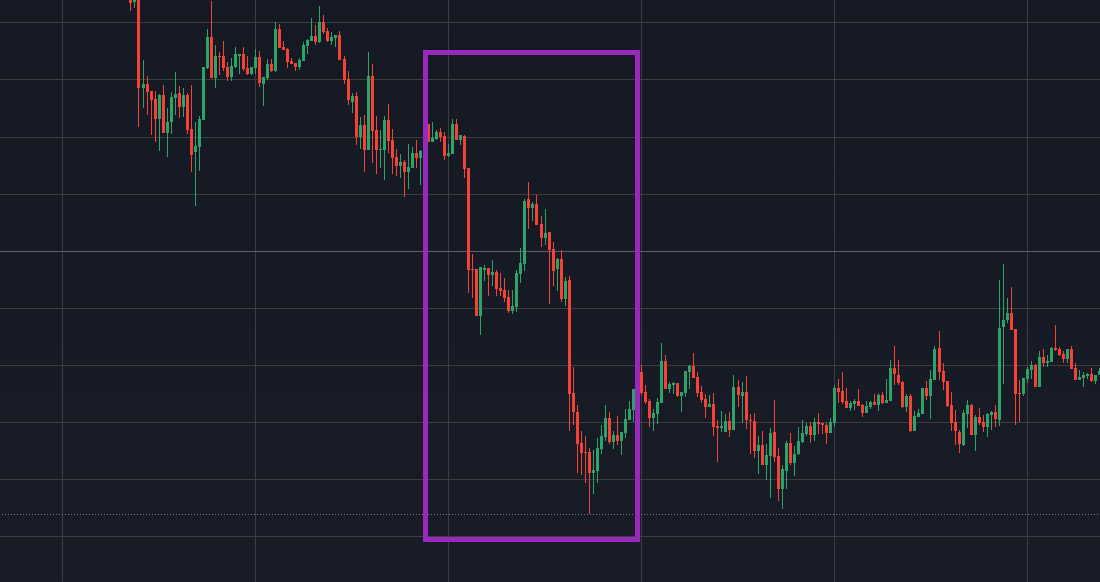
The H-pattern is one of the technical indicators many traders and analysts resort to when setting out their trading strategy, to harness the profit opportunities a vibrant market has to offer.
Understanding the H-pattern in trading
Definition of the ‘H’ chart pattern
An H-pattern reflects a lower case letter ‘h’ on the chart and typically indicates a steep decline of the assets price, followed by a short rebound and a subsequent continued downward trend.
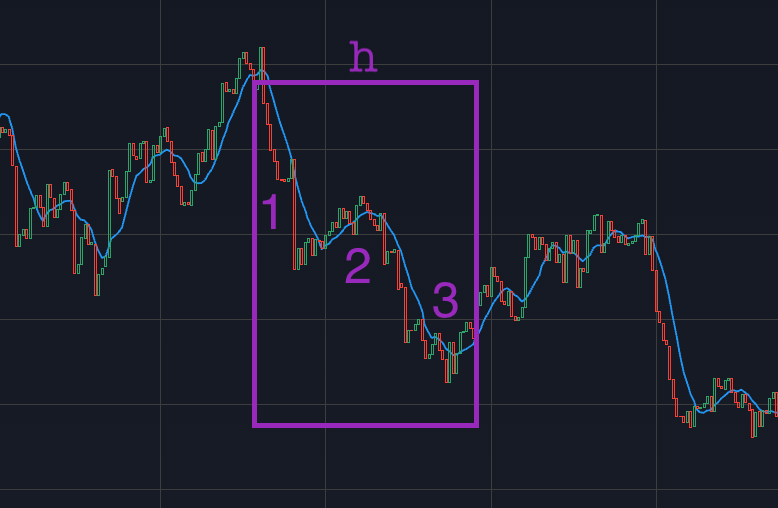
This three step price action pattern is a bearish indicator and is often considered a shorting signal when traders expect a market decline, with the asset reaching fresh lows.
Formation of the H-pattern
The formation of an H-Pattern occurs when a steep bearish candle reaches a support level and the price of an asset attempts to recover in a bullish rebound.
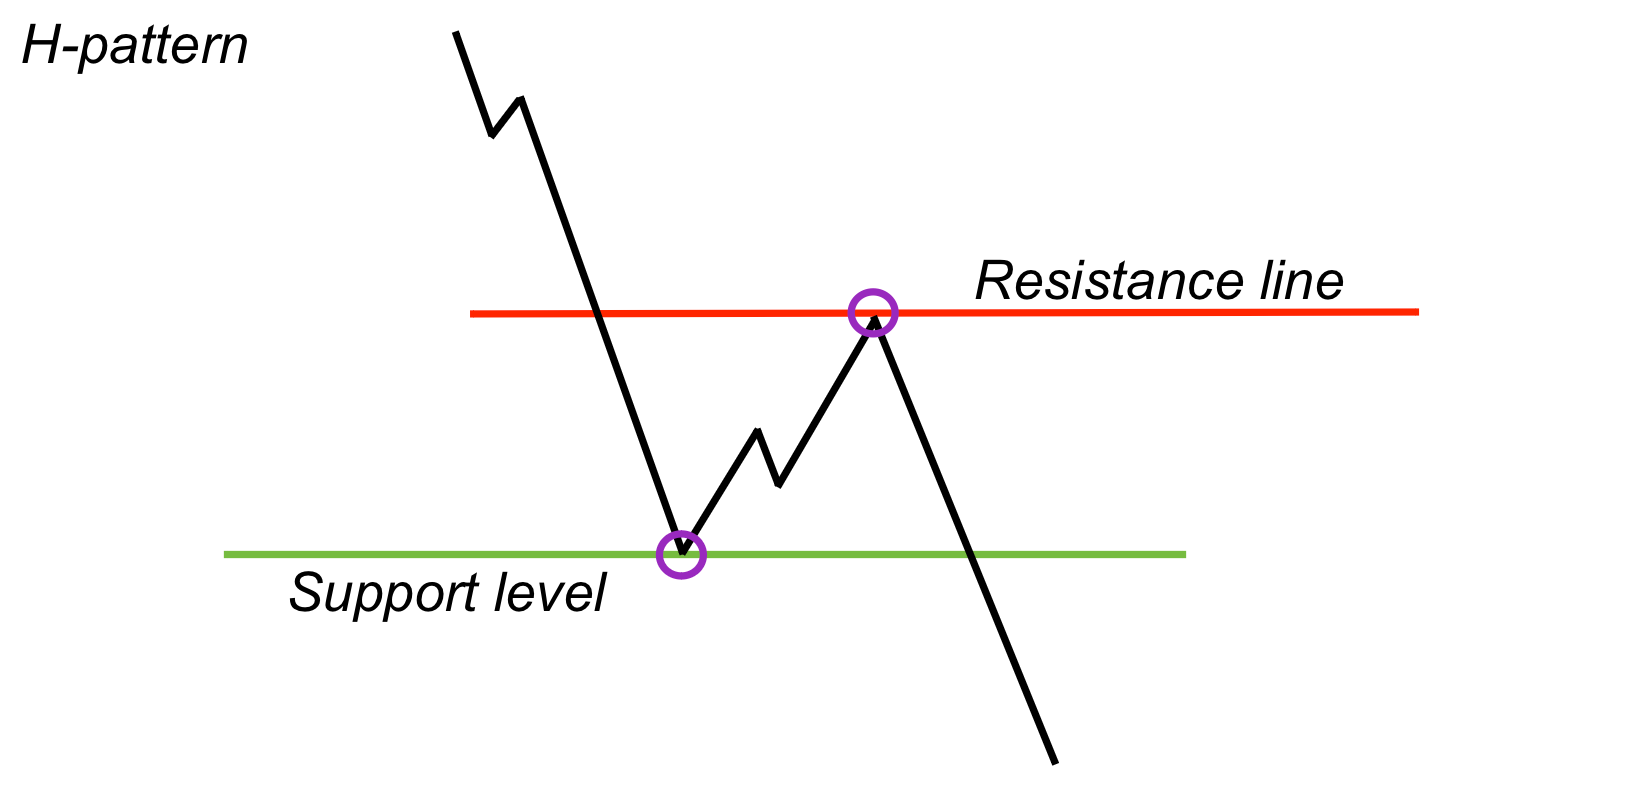
The culminating phase of the pattern unfolds when the highest candle of the bullish price rebound hits the resistance line and the price action reverses, falling below the support level and securing a new low point.
Identifying the H-pattern
Characteristics of the H-pattern on the Crypto market
Similar to other financial markets like Stock and Forex, the manifestation of H-patterns on the Crypto market is somewhat identical.
The essential price dash from the support level in the H-pattern often gives market participants a false alarm that the asset is rehabilitating, which results in a large buy-in.
As a result of the price not meeting the expectations, and failing to break out higher than the resistance line, a massive sell-off follows, which sees the price decline even further.
Tools for identifying the H-pattern
H-pattern trading can be complimented by an array of various technical and analytical tools that help in identifying the pattern, its validations, and in searching for a good trade entry point.
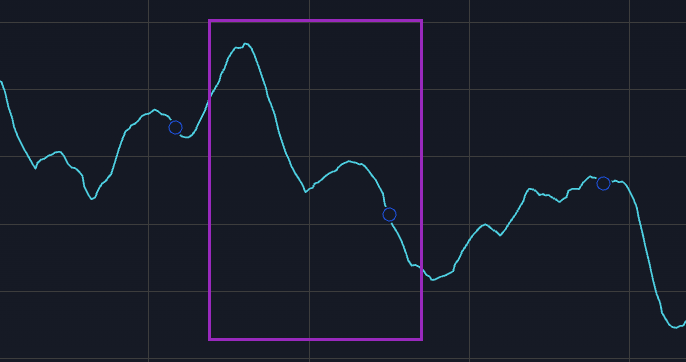
- Moving Average (MA). The Moving Average family of indicators are a good fit for identifying the trends, their directions, and/or to determine resistance and support levels.
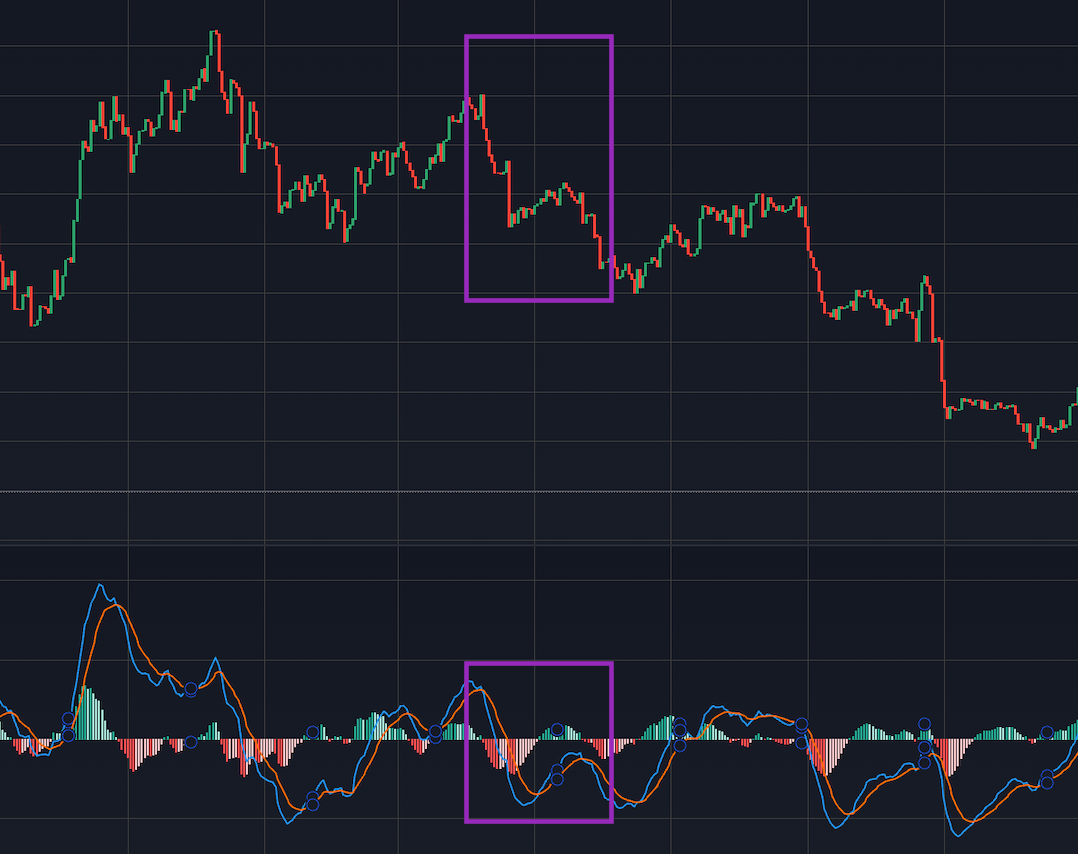
- MACD. Another handy indicator popular among pattern traders. It helps gauge whether the market is overbought or oversold, so you can stay informed on the strength of the price direction and alerted of any potential reversals.
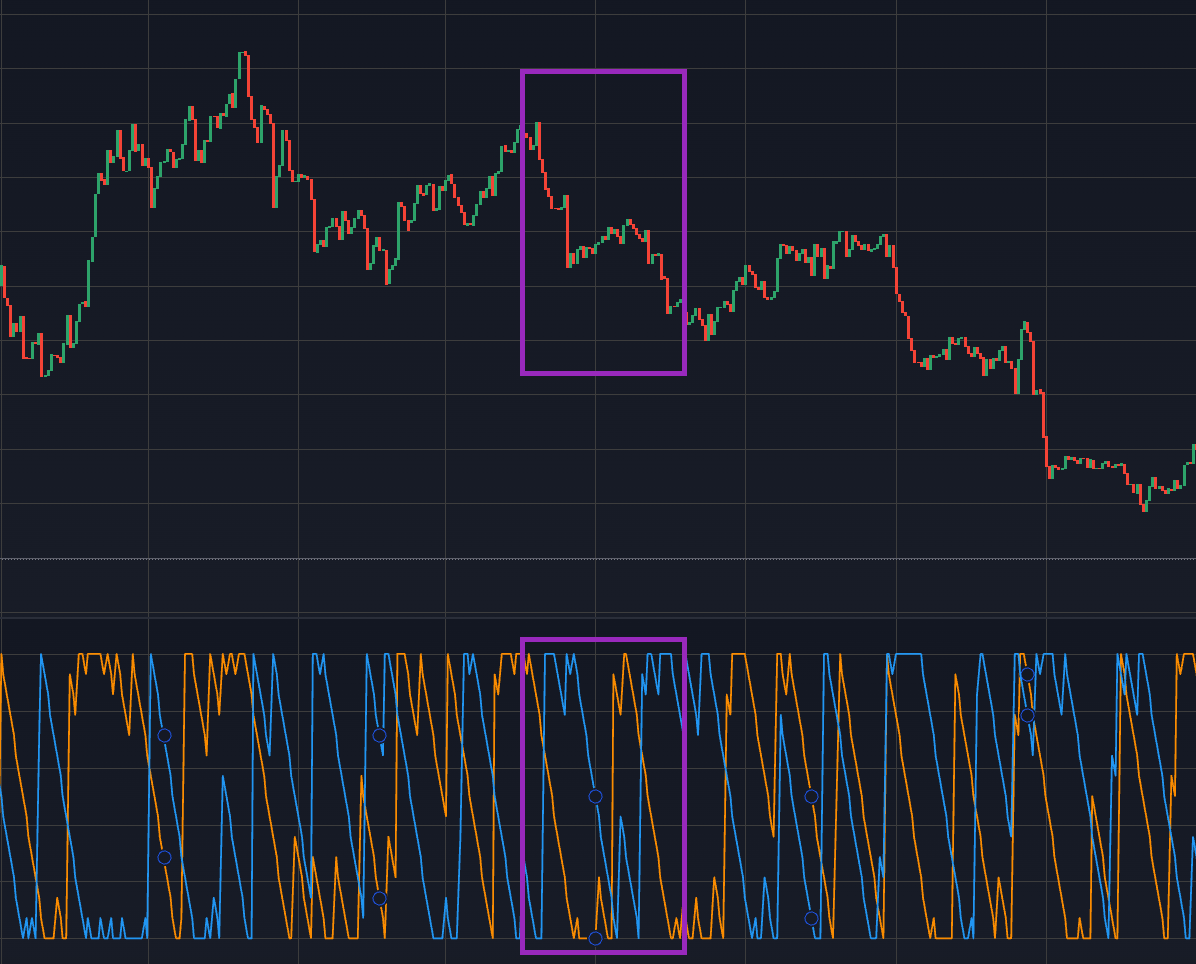
- Aroon. A great addition to any tool kit aimed at analysing a formation of a potential H-pattern. This technical indicator helps traders monitor trend changes in the price of an asset. it is also built to identify the strength of these trends.
Trading the H-pattern
Entry and exit points
Fundamentally, entry into a position trading an H-pattern requires its prior confirmation. Yet it provides more than just one potentially profitable entry point.
Going long from lows & short from highs may be a dangerous technique that would require substantial experience to conclude a profitable trade.
On the other hand, determining an exit point could be a much more difficult task. Carefully monitoring the trends and price rebounds is essential to avoid making premature or overestimated decisions. Devoting enough screen time and exercising patience is key to achieving better results.
Risk management and stop loss placement
Proper risk management and mindful assessment of the outset strategy should lie within any financial decision, especially when participating in highly volatile market action.
A recent decline in the value of an asset could be a misleading signal, as market sentiment is often unpredictable.
Combination of these factors substantially raises the risk to rewards ratio, nonetheless it can be countered by timely and properly placed stop loss orders.
Talent is not required to identify a good placement if accurate navigation using the resistance and support levels is applied.
Comparison with other chart patterns
Bear flag & Head and Shoulders pattern
H-pattern trading at times could be somewhat confusing due to the fact that other chart patterns have similarities, and one might get mislead in understanding what exactly the market is proposing.
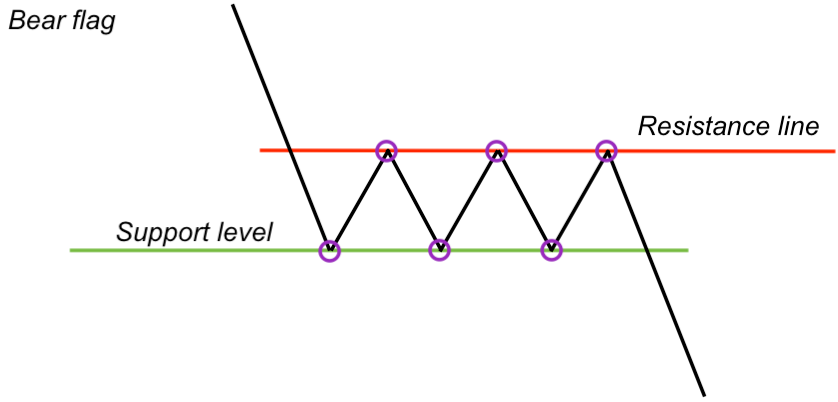
- Bear flag. The main difference between the H-pattern and the Bear flag is the amount of rebounds the price completes between the resistance and support lines before its final reverse towards the downtrend.
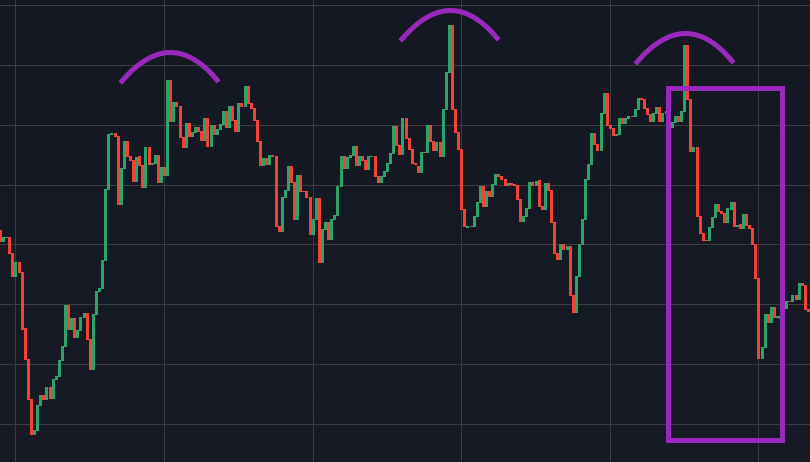
- Head and Shoulders pattern. Unlike the Bear flag, the Head and Shoulders chart pattern does not differ from the H-pattern. On the contrary, the main peculiarity of this pattern is that it is the ‘Big piece’ of the H-pattern that stands at its end point.
Conclusion
The H-pattern is a bearish chart pattern that resembles a letter ‘h’ upon its formation and can be an effective tool to benefit from.
Many investors resort to this type of pattern trading to extract maximum profit in limited conditions on the market.
This pattern is relatively simple to comprehend and apply in trading, which is why it is a good fit for both experienced and novice traders.
Many technical indicators and various charting tools are applicable to it and can diversify the approach towards analysing this trading technique.
The content provided here is for informational purposes only. It is not intended as personal investment advice and does not constitute a solicitation or invitation to engage in any financial transactions, investments, or related activities. Past performance is not a reliable indicator of future results.
The financial products offered by the Company are complex and come with a high risk of losing money rapidly due to leverage. These products may not be suitable for all investors. Before engaging, you should consider whether you understand how these leveraged products work and whether you can afford the high risk of losing your money.
The Company does not accept clients from the Restricted Jurisdictions as indicated in our website/ T&C. Some services or products may not be available in your jurisdiction.
The applicable legal entity and its respective products and services depend on the client’s country of residence and the entity with which the client has established a contractual relationship during registration.

