How Trading Indicator can support your Trading
Technical analysis is the foundation of informed trading decisions, providing traders with insights into market movements through chart analysis. For Bitcoin traders, in particular, this is crucial, as Bitcoin’s notorious volatility presents both opportunities and risks. By leveraging the right indicators, traders can identify optimal entry and exit points to maximize their profits—especially when shorting Bitcoin.
In this article, we’ll explore ten of the most powerful technical indicators that can help traders navigate Bitcoin’s price fluctuations. Whether you’re a day trader or a swing trader, understanding these indicators will enhance your trading strategy.
The 10 Essential Technical Indicators for Bitcoin Trading
Technical analysis relies on various indicators to interpret price action and predict future movements. Here are the top 10 technical indicators every trader should know:
- Bollinger Bands – Measures volatility and identifies overbought/oversold conditions.
- Williams Alligator Indicator – Recognizes emerging trends and market phases.
- MACD (Moving Average Convergence Divergence) – Detects momentum shifts and trend reversals.
- Relative Strength Index (RSI) – Measures momentum to determine overbought and oversold levels.
- Ichimoku Kinko Hyo – Provides a comprehensive view of trend direction, momentum, and support/resistance levels.
- Stochastic Oscillator – Compares an asset’s closing price to its historical price range.
- Exponential Moving Average (EMA) – Highlights market trends and smooths price action.
- On-Balance Volume (OBV) – Uses volume data to confirm price trends.
- Parabolic SAR (Stop and Reverse) – Helps traders identify potential trend reversals.
- Average Directional Index (ADX) – Evaluates trend strength and momentum.
Each of these indicators serves a specific purpose, allowing traders to analyze market conditions and make informed decisions.
Let’s take a closer look at how each works and when to use them.
1. Bollinger Bands: Measuring Market Volatility
Bollinger Bands help traders assess market volatility by setting upper and lower price bands around an asset’s moving average. When the bands widen, volatility is high; when they contract, volatility is low.
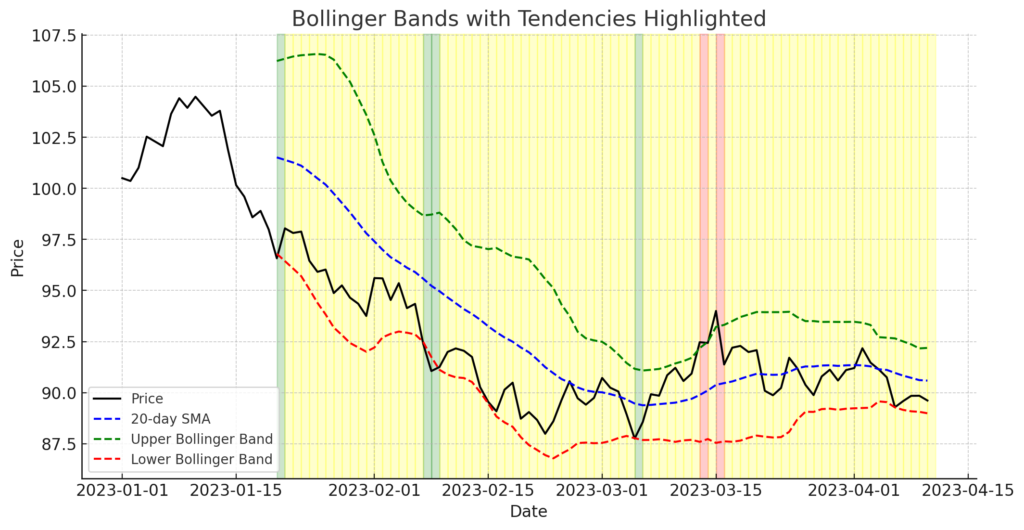
How to use it:
- Green Zones 📈: Indicate potential oversold conditions, where the price is below the lower Bollinger Band.
- Red Zones 📉: Indicate potential overbought conditions, where the price is above the upper Bollinger Band.
- Yellow Zones ⚖️: Indicate the price is within the Bollinger Bands, suggesting a normal range of activity.
2. Williams Alligator Indicator: Spotting Trend Formation
Named after its resemblance to an alligator’s jaws, teeth, and lips, this indicator consists of three moving averages that signal trend emergence.
How to use it:
- When the lines diverge, the market is trending.
- When the lines converge, the market is in consolidation.
- If the ‘jaws’ open downward, it suggests a shorting opportunity.
Here is a chart illustrating the Williams Alligator Indicator:
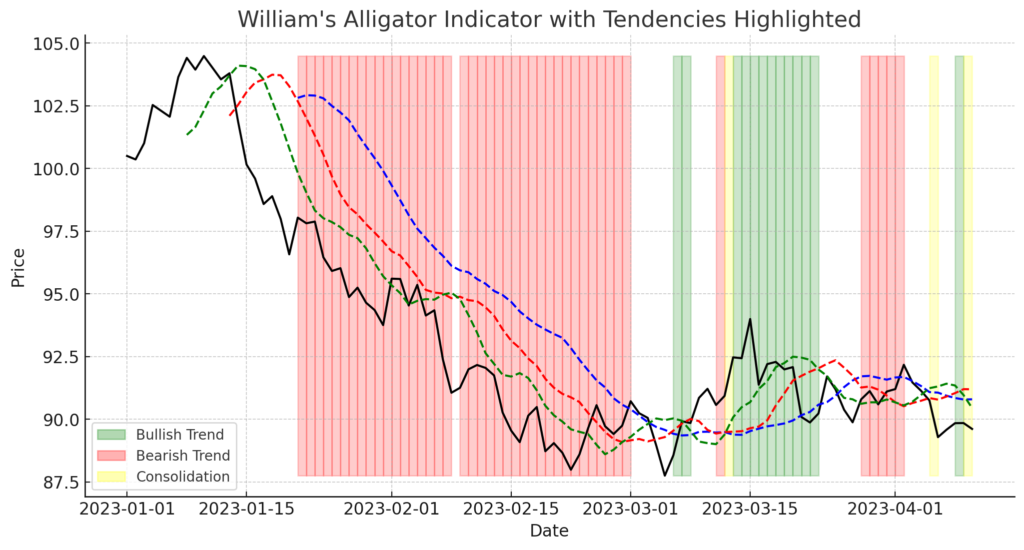
- Green Zones 📈: Indicate a Bullish Trend, where the Lips (Green) > Teeth (Red) > Jaw (Blue).
- Red Zones 📉: Indicate a Bearish Trend, where the Lips (Green) < Teeth (Red) < Jaw (Blue).
- Yellow Zones ⚖️: Indicate Consolidation, where the Alligator is “sleeping” (low volatility and no trend).
3. MACD: Identifying Momentum and Trend Reversals
The MACD is a momentum indicator that tracks trend direction by analyzing two moving averages.
How to use it:
- When the MACD crosses above the signal line, it signals a potential uptrend.
- When it crosses below, it suggests a downtrend.
- Histogram bars indicate trend strength—longer bars mean stronger momentum.
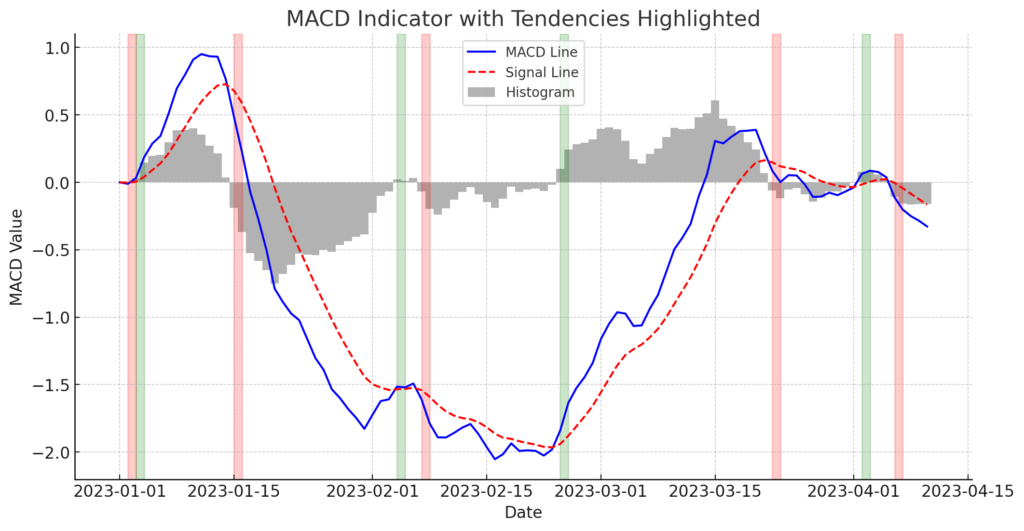
MACD (Moving Average Convergence Divergence) indicator with tendencies highlighted:
- Blue Line: The MACD Line (difference between 12-day and 26-day EMAs).
- Red Dashed Line: The Signal Line (9-day EMA of the MACD Line).
- Gray Histogram: The difference between the MACD Line and the Signal Line.
Highlighted Zones:
- Green Zones 📈: Indicate a Bullish Crossover, where the MACD Line crosses above the Signal Line (potential buy signal).
- Red Zones 📉: Indicate a Bearish Crossover, where the MACD Line crosses below the Signal Line (potential sell signal).
4. Relative Strength Index (RSI): Determining Overbought and Oversold Conditions
RSI is a momentum oscillator that ranges from 0 to 100. It helps traders assess whether an asset is overbought or oversold.
How to use it:
- If RSI is above 70, Bitcoin is overbought and may soon decline.
- If RSI is below 30, Bitcoin is oversold and may rebound.
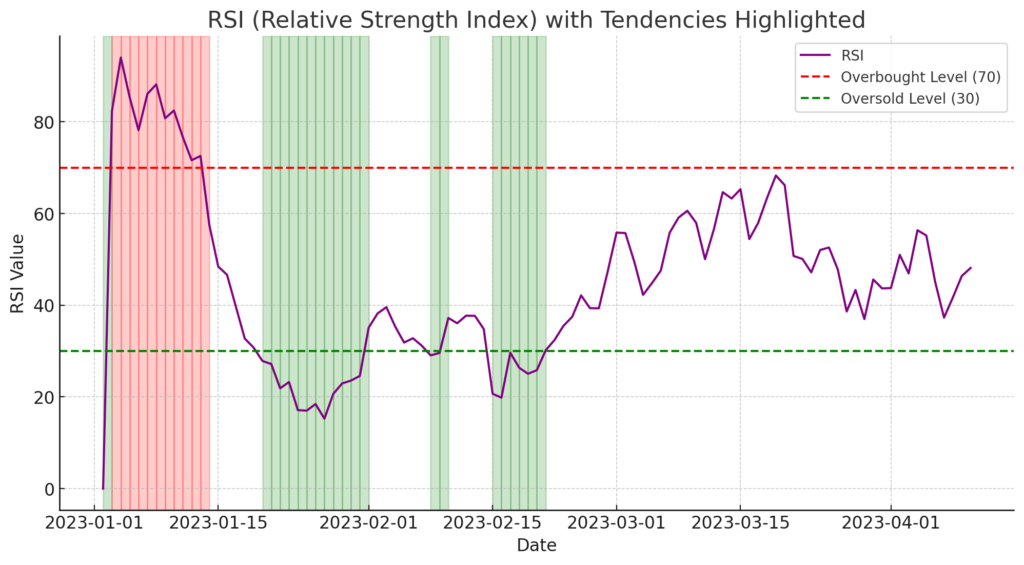
Relative Strength Index (RSI) with tendencies highlighted:
- Purple Line: The RSI, which oscillates between 0 and 100.
- Red Dashed Line: The Overbought Level (70), where prices might be overvalued.
- Green Dashed Line: The Oversold Level (30), where prices might be undervalued.
Highlighted Zones:
- Red Zones 📉: RSI above 70, signaling potential overbought conditions (possible reversal or correction).
- Green Zones 📈: RSI below 30, signaling potential oversold conditions (possible upward movement).
5. Ichimoku Kinko Hyo: A Comprehensive Trend Indicator
This all-in-one indicator provides a broad picture of support, resistance, and momentum.
How to use it:
- Price above the cloud = bullish trend.
- Price below the cloud = bearish trend.
- Cloud thickness = strength of support/resistance.
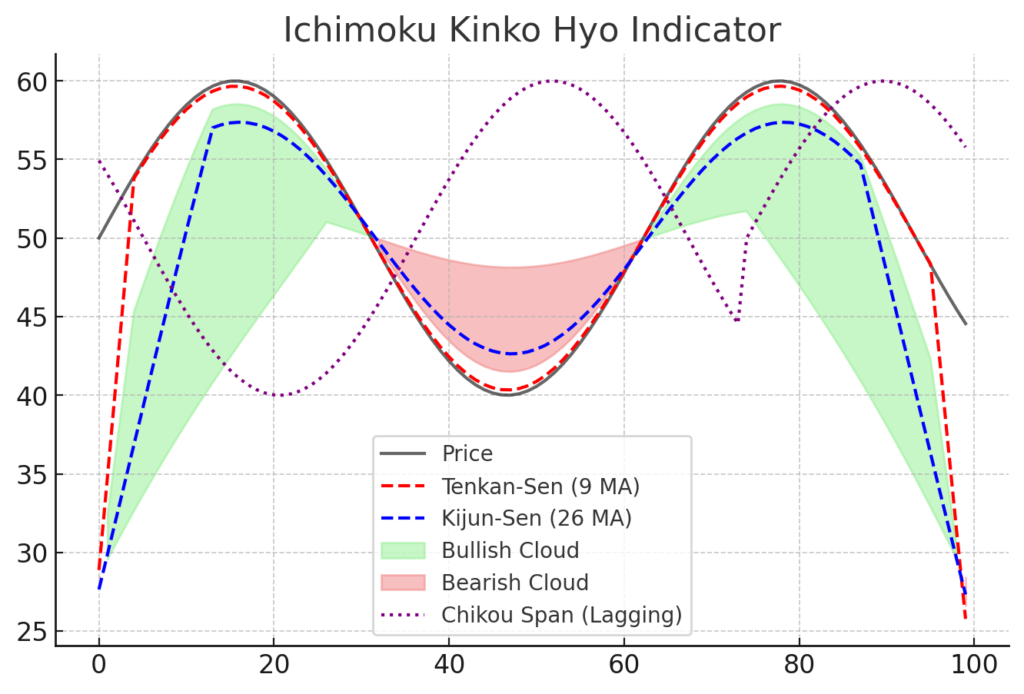
Here is a chart illustrating the Ichimoku Kinko Hyo Indicator:
- Tenkan-Sen (red dashed line): Short-term trend line (9-period moving average).
- Kijun-Sen (blue dashed line): Medium-term trend line (26-period moving average).
- Senkou Span A & B (cloud):
- Green cloud (bullish) forms when Span A is above Span B.
- Red cloud (bearish) forms when Span A is below Span B.
- Chikou Span (purple dotted line): Lagging indicator showing past price movements.
6. Stochastic Oscillator: Confirming Momentum Strength
This indicator compares Bitcoin’s closing price to its price range over a set period.
How to use it:
- When the Stochastic Oscillator is above 80, Bitcoin is considered overbought, meaning a potential price decline.
- When the Stochastic Oscillator is below 20, Bitcoin is oversold, meaning a possible price increase.
- Crossovers between %K and %D lines signal trend shifts and potential trading opportunities.
- %K Line (blue): Represents the current price level relative to the high-low range over a given period.
- %D Line (red dashed): A 3-period moving average of %K, smoothing out fluctuations.
- Overbought Level (80, green dotted line): Signals that the asset may be overbought.
- Oversold Level (20, purple dotted line): Indicates the asset may be oversold
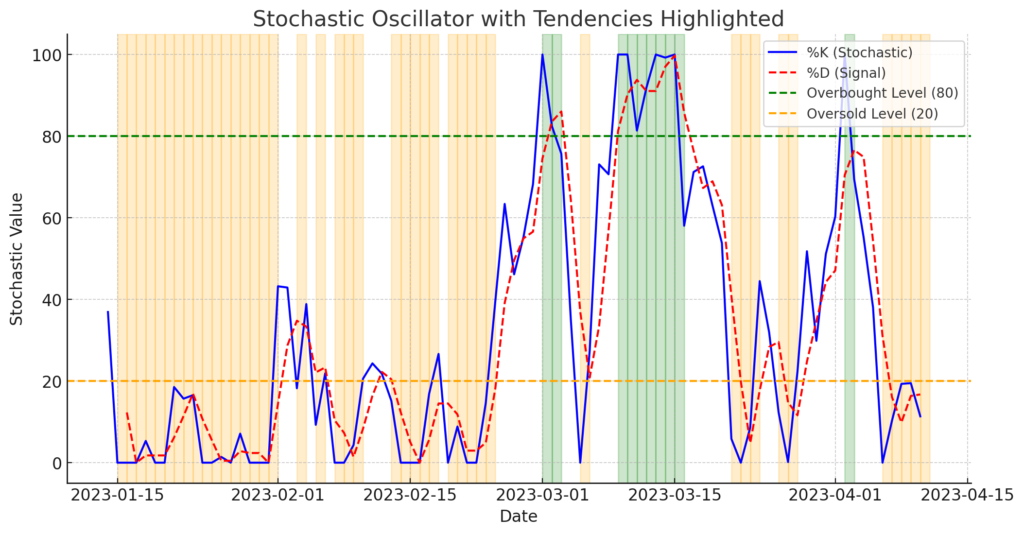
Stochastic Oscillator with tendencies highlighted:
- Blue Line: %K (the fast Stochastic line).
- Red Dashed Line: %D (the signal line, which is a smoothed %K).
- Green Dashed Line: Overbought level (80).
- Orange Dashed Line: Oversold level (20).
Highlighted Zones:
- Green Zones 📈: Stochastic %K values above 80 (Overbought condition).
- Orange Zones 📉: Stochastic %K values below 20 (Oversold condition).
7. Exponential Moving Average (EMA): Smoothing Price Data
The EMA gives more weight to recent prices, making it ideal for tracking trends.
How to use it:
- A short-term EMA crossing above a long-term EMA signals a buy.
- A short-term EMA crossing below a long-term EMA signals a sell.
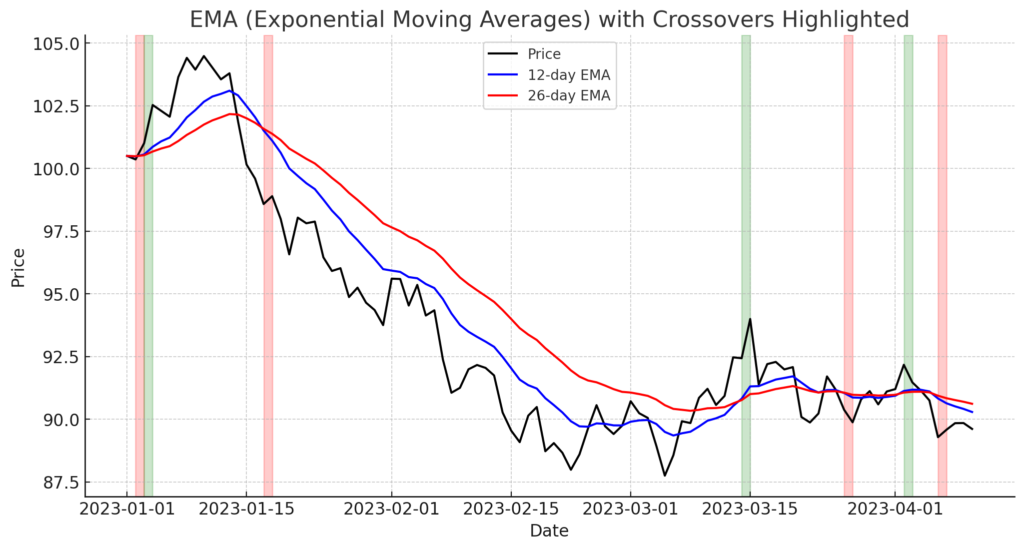
Exponential Moving Averages (EMAs) with crossover tendencies highlighted:
- Black Line: Price
- Blue Line: 12-day EMA (short-term trend)
- Red Line: 26-day EMA (long-term trend)
Highlighted Zones:
- Green Zones 📈: Bullish crossovers, where the short-term EMA (12-day) crosses above the long-term EMA (26-day).
- Red Zones 📉: Bearish crossovers, where the short-term EMA crosses below the long-term EMA.
8. On-Balance Volume (OBV): Volume-Based Trend Confirmation
OBV tracks volume changes to confirm price movements.
How to use it:
- Rising OBV with price increase → Strong uptrend confirmation (indicates buying pressure).
- Falling OBV with price decrease → Strong downtrend confirmation (suggests selling pressure).
- Divergence between OBV and price → Potential trend reversal signal
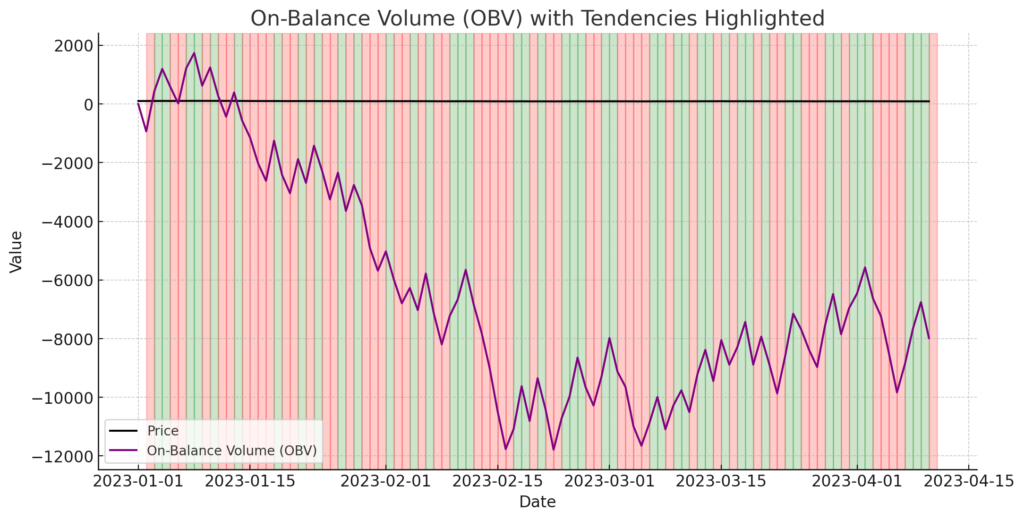
On-Balance Volume (OBV) with highlighted tendencies:
- Green Zones 📈: Periods where OBV is increasing, indicating potential bullish momentum.
- Red Zones 📉: Periods where OBV is decreasing, indicating potential bearish momentum.
9. Parabolic SAR: Identifying Trend Reversals
This indicator uses dots above or below price action to signal trend direction.
How to use it:
- Dots below the price → Uptrend (buy signal).
- Dots above the price → Downtrend (sell signal).
- Dots flipping sides → Trend reversal signal (potential entry/exit points).
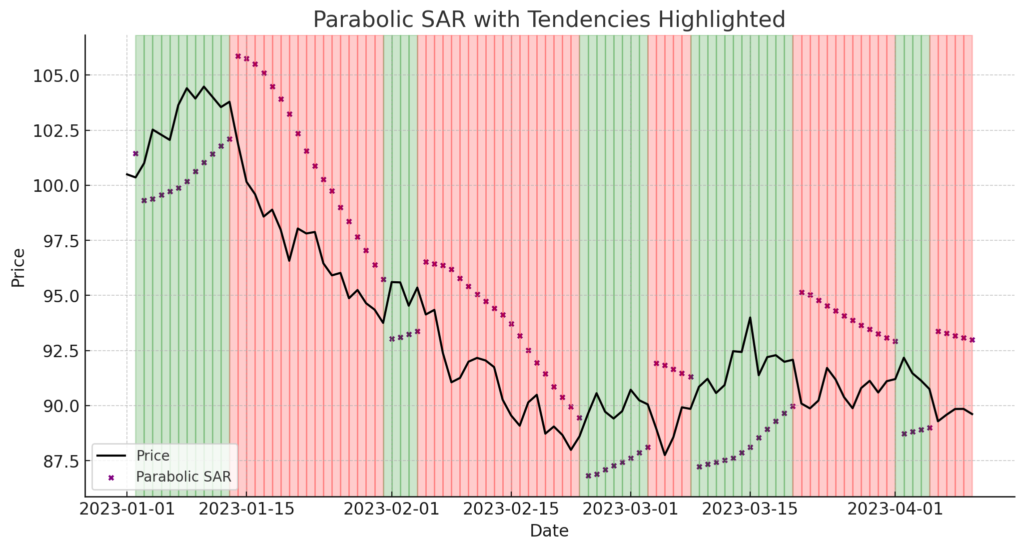
- Parabolic SAR with highlighted tendencies:
- Black Line: Price.
- Purple Dots: Parabolic SAR values indicating trend direction.
- Green Zones 📈: Periods of an uptrend, where the SAR is below the price.
- Red Zones 📉: Periods of a downtrend, where the SAR is above the price.
10. Average Directional Index (ADX): Measuring Trend Strength
How to use it:
- ADX above 50 → Strong trend (trending market)
- ADX below 25 → Weak trend (sideways market)
- Rising ADX → Increasing trend strength
- Falling ADX → Weakening trend momentum.
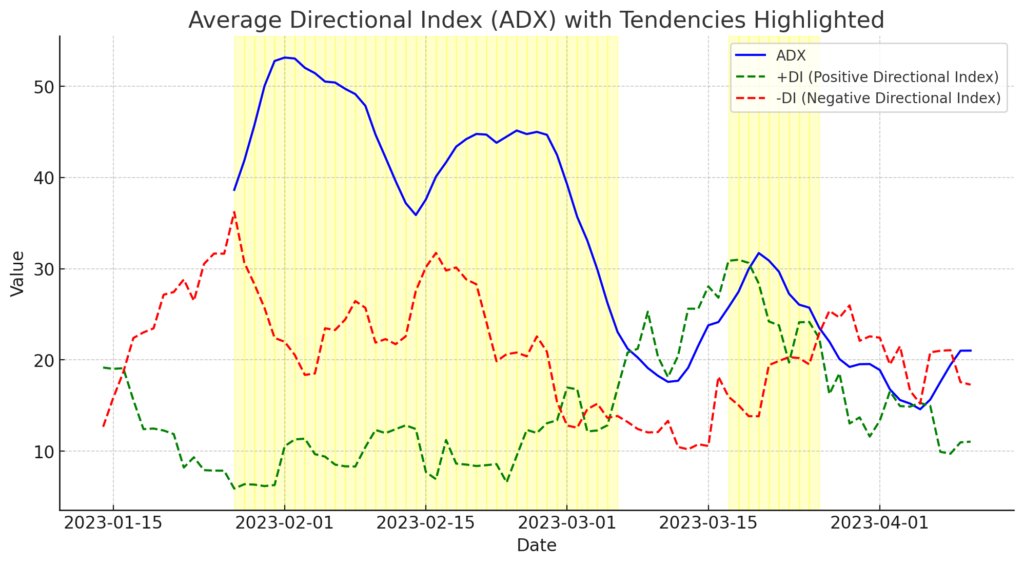
Average Directional Index (ADX) with tendencies highlighted:
- Blue Line: ADX, which measures the strength of a trend.
- Green Dashed Line: +DI (Positive Directional Index), representing bullish strength.
- Red Dashed Line: -DI (Negative Directional Index), representing bearish strength.
- Yellow Zones ⚡: Highlight periods where ADX > 25, indicating a strong trend (either bullish or bearish).
Choosing the Best Indicators for Different Trading Styles
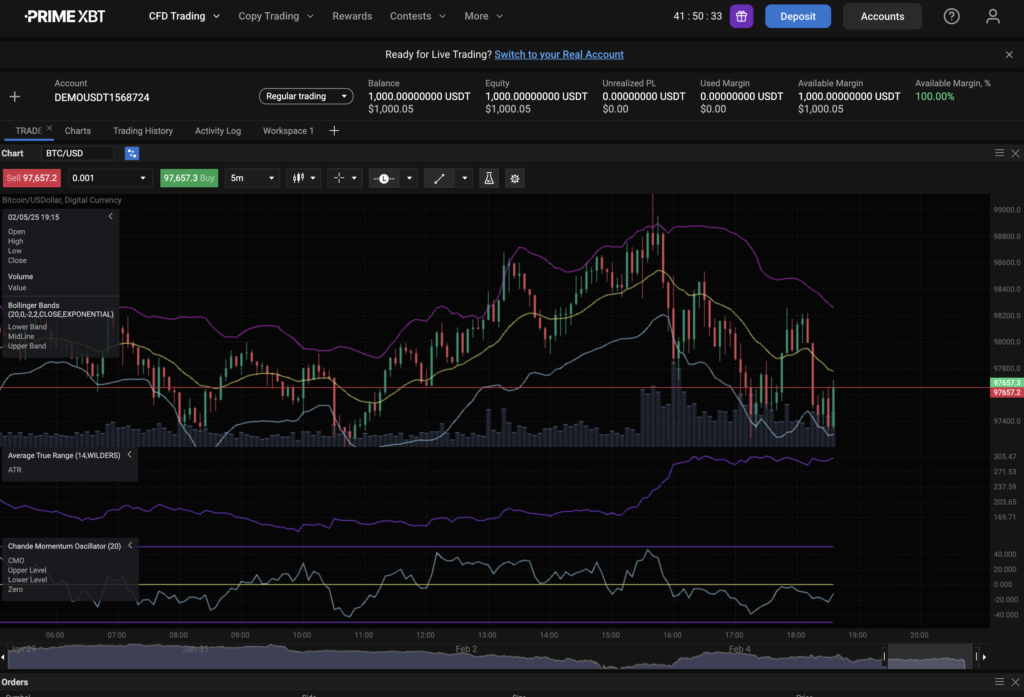
Best Indicators for Day Trading
Day traders need fast, reliable indicators to capitalize on quick price movements:
- Moving Averages for trend identification.
- Bollinger Bands for volatility analysis.
- Momentum Oscillators to capture short-term price swings.
Best Indicators for Swing Trading
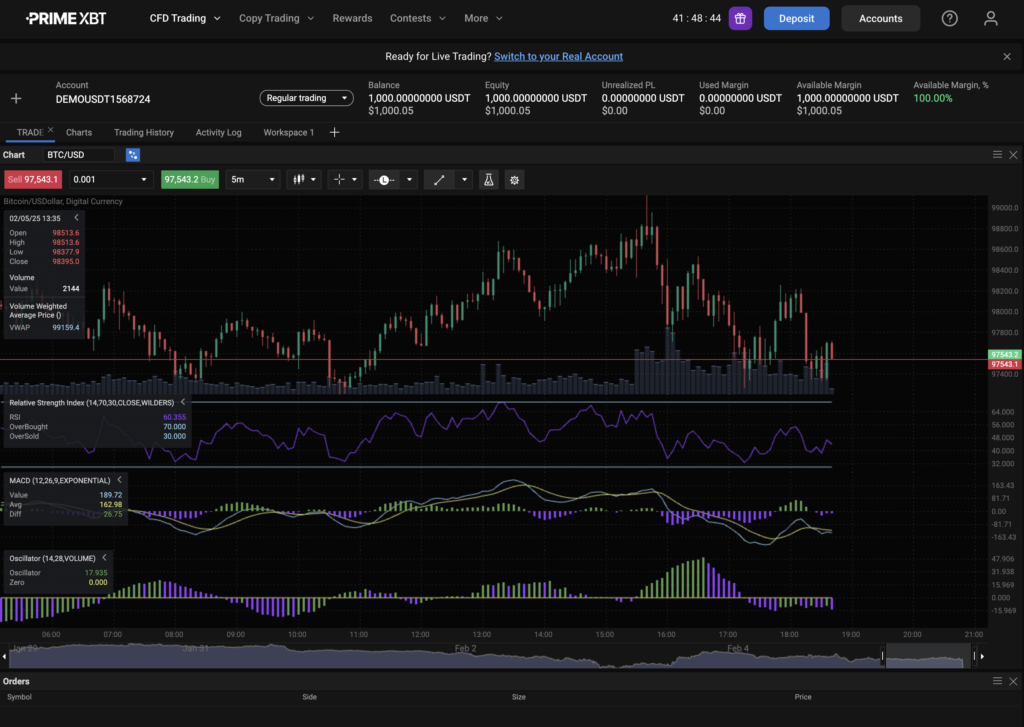
Swing traders hold positions for days or weeks, relying on longer-term indicators:
- RSI for spotting market reversals.
- Volume Analysis to confirm trends.
- MACD + Stochastic Oscillator for enhanced accuracy.
Combining Trading Indicators for Maximum Accuracy
Traders often combine indicators for greater precision. A common strategy is:
- MACD + RSI + Stochastic: If all three align, a trade signal is stronger.
- Bollinger Bands + ADX: Identifies breakout potential with trend strength confirmation.
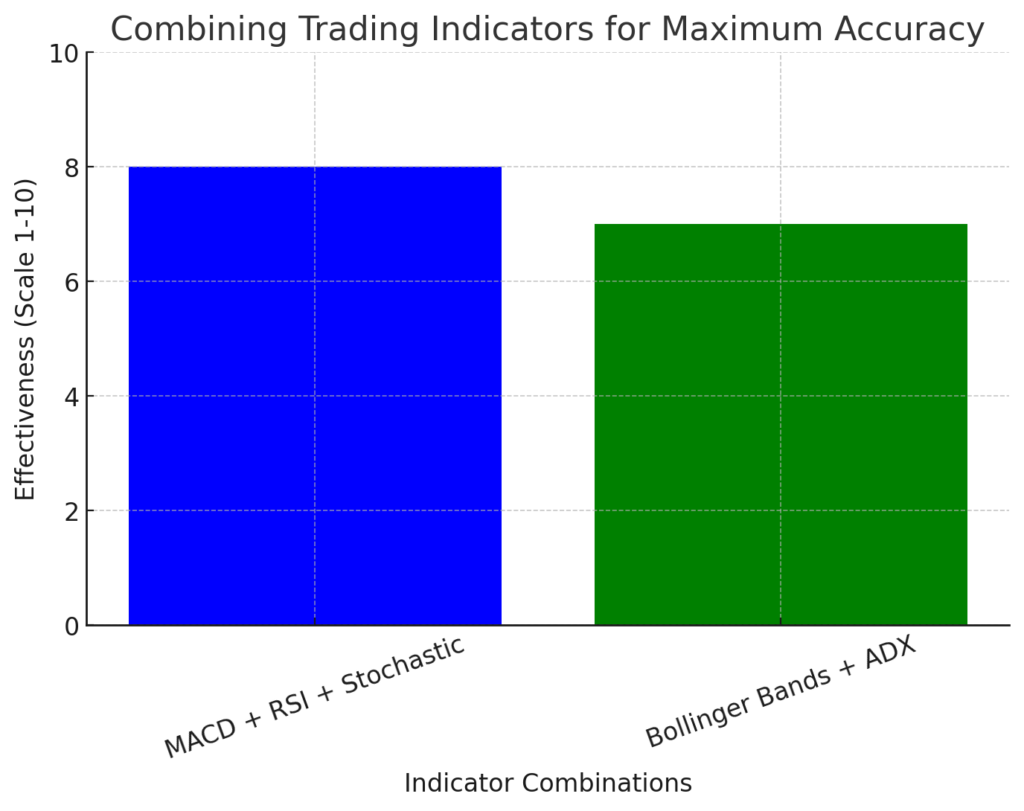
The chart illustrates the effectiveness of two common trading indicator combinations:
- MACD + RSI + Stochastic – This combination is highly effective (rated 8/10) because it aligns momentum (MACD), overbought/oversold levels (RSI), and price range strength (Stochastic). When all three indicators signal the same trend, traders gain higher confidence in their trade decisions.
- Bollinger Bands + ADX – This combination scores slightly lower (7/10) but remains powerful. Bollinger Bands help identify potential breakout points, while ADX confirms trend strength. This is particularly useful for traders looking for strong price movements before entering a trade.
Key Takeaways for Mastering Technical Analysis
- Technical analysis is a powerful tool for predicting Bitcoin’s price movements.
- Learning multiple indicators and how to combine them improves accuracy.
- Practicing with real market data builds confidence and skill.
Start implementing these strategies today and gain an edge in Bitcoin trading with PrimeXBT’s advanced charting tools!
Conclusion- Trading Indicators
Successful trading isn’t just about luck—it’s about making informed decisions backed by solid technical analysis. Understanding and combining indicators like MACD, RSI, Stochastic, Bollinger Bands, and ADX can help traders navigate market trends with greater confidence. Whether you’re a day trader looking for quick opportunities or a swing trader seeking larger market moves, leveraging the right tools is key to maximizing profitability.
At PrimeXBT, traders gain access to an advanced trading platform designed to support their strategies with cutting-edge charting tools, seamless trade execution, and a range of customizable indicators. With the ability to trade both long and short positions on Bitcoin and other assets, traders can capitalize on market movements in any direction. The platform’s powerful features, coupled with high liquidity and competitive conditions, ensure that traders can act quickly and efficiently when opportunities arise.
The best way to refine your trading strategy is through practice and real-time market analysis. Start trading today with PrimeXBT and put these insights into action.
What are the most commonly used trading indicators?
The most popular indicators are Moving Averages (e.g., SMA, EMA), RSI, Bollinger Bands, MACD, and Stochastic Oscillators.
How do Moving Averages help traders?
They smooth price data to identify trends over a specific period, helping traders spot bullish or bearish trends.
What is RSI and how is it used?
RSI (Relative Strength Index) measures momentum and identifies overbought (above 70) or oversold (below 30) conditions.
Why are Bollinger Bands important?
Bollinger Bands measure market volatility and indicate whether prices are high or low relative to historical averages, aiding in entry and exit points.
Can I use multiple indicators together?
Yes, combining indicators like MACD with RSI or Bollinger Bands provides more reliable signals by confirming trends and momentum.
The content provided here is for informational purposes only. It is not intended as personal investment advice and does not constitute a solicitation or invitation to engage in any financial transactions, investments, or related activities. Past performance is not a reliable indicator of future results.
The financial products offered by the Company are complex and come with a high risk of losing money rapidly due to leverage. These products may not be suitable for all investors. Before engaging, you should consider whether you understand how these leveraged products work and whether you can afford the high risk of losing your money.
The Company does not accept clients from the Restricted Jurisdictions as indicated in our website/ T&C. Some services or products may not be available in your jurisdiction.
The applicable legal entity and its respective products and services depend on the client’s country of residence and the entity with which the client has established a contractual relationship during registration.


