Ever feel lost trying to figure out the ups and downs of the market? Technical analysis can be a powerful tool for traders, and the Swing Failure Pattern (SFP) is a valuable technique for spotting potential trend reversals. This guide will equip you to identify SFPs, understand their significance, and incorporate them into your trading strategies.
Key takeaways
- Catch potential trend shifts: master the SFP to anticipate and potentially profit from market reversals.
- Versatility across markets: SFPs are effective in various markets, whether you’re trading Stocks, Forex, or Cryptocurrency.
- Confirmation is key: combine SFPs with other technical indicators for stronger trade signals and increased confidence.
- Manage your risk: proper risk management, including stop-loss orders, is crucial for any trading strategy.
Ready to dive deeper? Let’s explore the world of SFPs!
What is the Swing Failure Pattern?
Ever wondered what those sharp price swings on a chart might be telling you? The Swing Failure Pattern (SFP) can help you interpret these movements and potentially forecast trend shifts. This knowledge empowers you to make informed decisions about entering or exiting positions strategically.
The significance of the Swing Failure Pattern
Let’s explore the significance of SFPs, and how they can benefit your trading strategy.
SFPs function as potential trend reversal signals. By recognising these patterns, you can anticipate a shift in the market’s direction and potentially capitalise on profitable opportunities.
SFPs can help you identify potential buying and selling opportunities by tipping you off to entry and exit points for trades. Bullish SFPs might suggest buying opportunities, while bearish SFPs might indicate potential selling points.
The beauty of SFPs lies in their versatility. They can be applied to various asset classes, including Stocks, Forex, and Cryptocurrency markets.
While SFPs are valuable tools, combining them with volume and other technical indicators can strengthen your trade signals and boost your confidence.
As you’ll see, Swing Failure Patterns are powerful allies in navigating the ever-changing market landscape. But before incorporating them into your strategies, understanding how to identify them is crucial.
Identifying Swing Failure Patterns
Now that you understand the significance of SFPs, let’s help you to identify them on your charts. By recognising these patterns, you’ll gain valuable insight into potential trend reversals.
Characteristics of bullish and bearish SFPs
Swing Failure Patterns come in two flavours; bullish and bearish. Here’s how to distinguish between them.
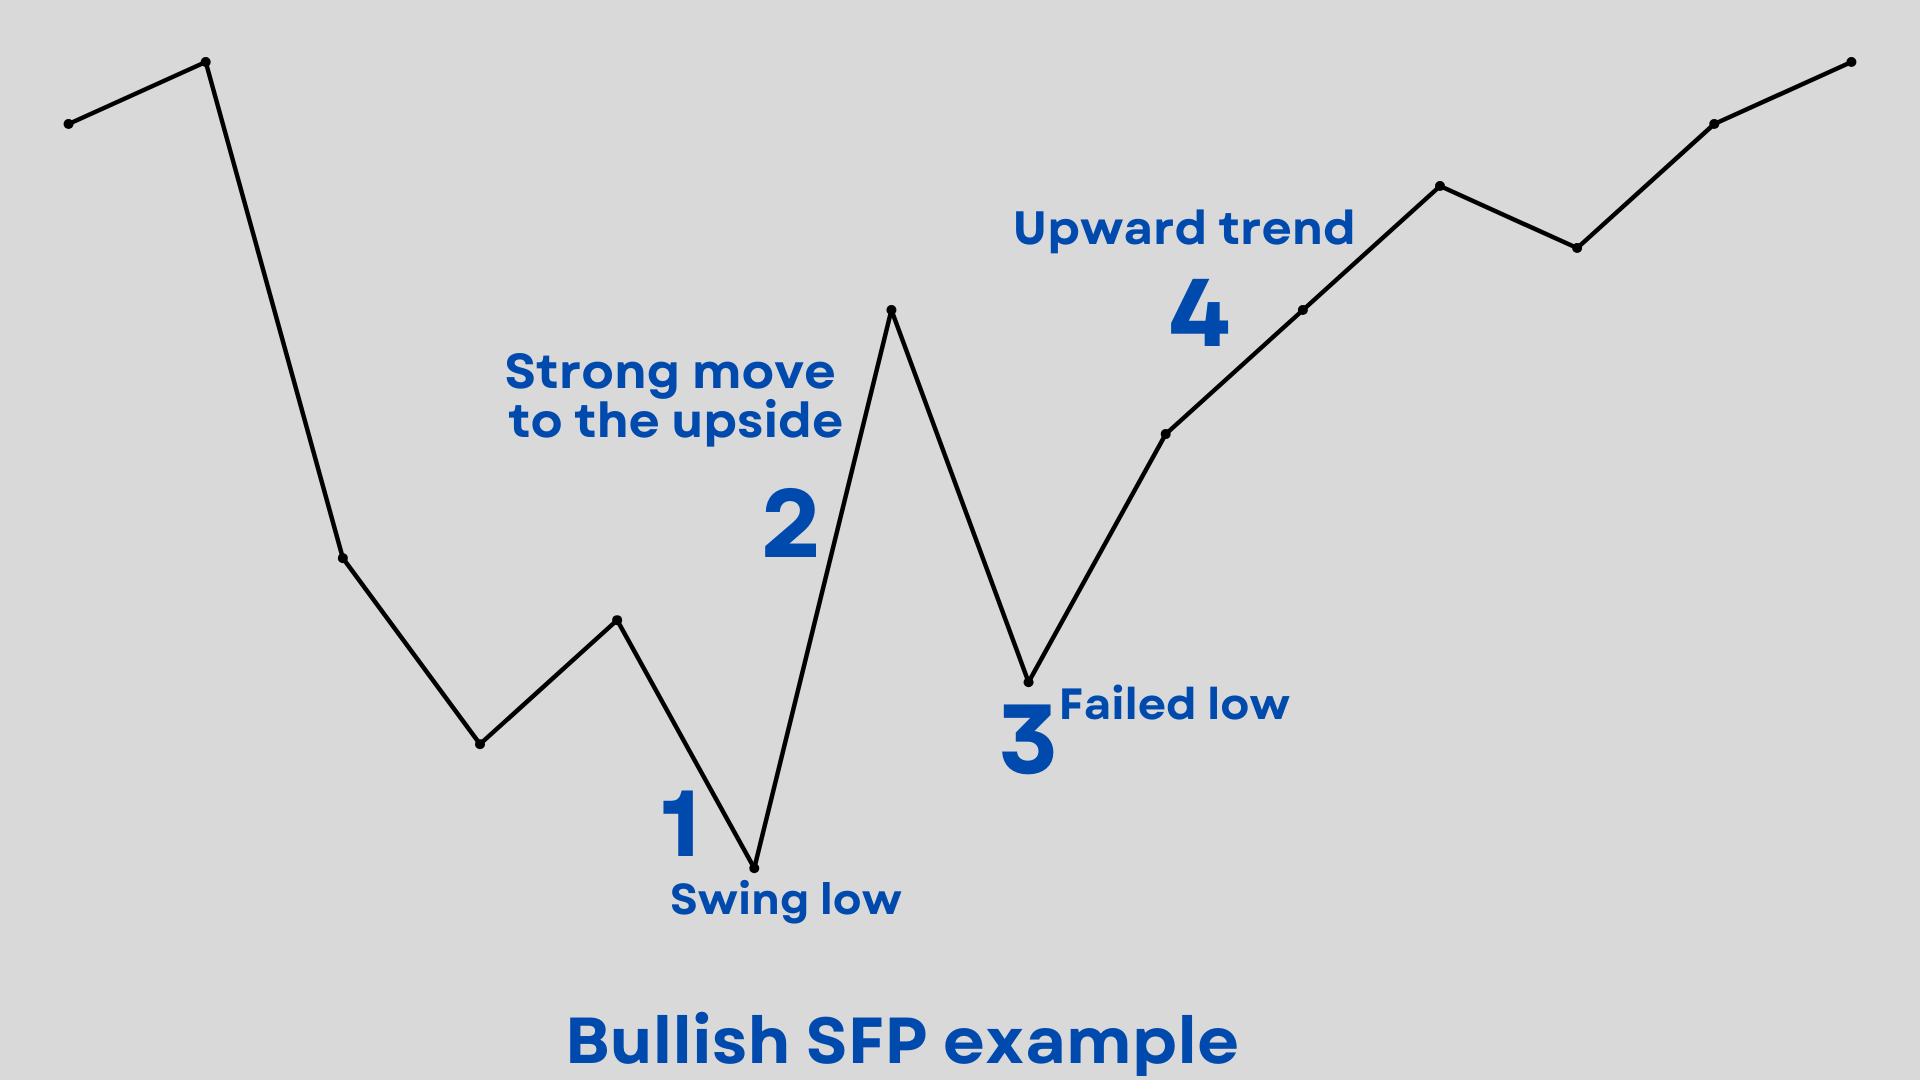
- Swing highs and lows: identifying swing highs (highest points) and swing lows (lowest points) is crucial for recognising SFPs
- Bullish SFP criteria: a bullish swing failure pattern occurs when the price of the asset fails to break below a recent swing low, followed by a move upwards. This suggests a potential reversal from a downtrend to an uptrend
- Bearish SFP criteria: conversely, a bearish swing failure pattern appears when the price of the asset fails to climb above a recent swing high, followed by a move downwards. This could indicate a potential shift from an uptrend to a downtrend
By mastering these characteristics, you’ll be well on your way to spotting SFPs and potentially capitalising on trend reversals.
Effective trading strategies using Swing Failure Patterns
Now that you can identify SFPs, let’s explore how to use them for strategic trading decisions.
Timing entries and exits for a Swing Failure Pattern
The key lies in pinpointing optimal entry and exit points. Here’s what to consider:
- Confirmation strategies: don’t rely solely on SFPs. Look for confirmation from other technical indicators for stronger signals before entering a trade.
- Price targets: SFPs can help set realistic profit targets. Consider targeting previous swing highs (for bullish trades) or resistance levels.
- Risk management: always prioritise risk management. Use stop-loss orders to limit potential losses, regardless of your trading strategy, including SFP-based approaches.
- Trend or reversal: SFPs can be used for both trend-following and reversal strategies. Analyse the overall trend and SFP formation to determine the best approach.
Using SFP with other indicators
The true power of SFPs lies in their synergy with other technical indicators. Combining SFPs with indicators like RSI (Relative Strength Index) or MACD (Moving Average Convergence Divergence) can strengthen trade confirmation. SFPs near support or resistance zones can provide even more weight to potential trend reversals.
By incorporating these additional tools, you can make more informed trading decisions and navigate the market with greater confidence.
How to use the Swing Failure Pattern to trade
Now that you’ve grasped how to identify the Swing Failure Pattern, and basic strategies to trade it, let’s explore how to adapt them to your specific trading style.
Optimal time frames
The optimal timeframe for SFP trading depends on your strategy and risk tolerance. Short time frames like hourly charts can be suitable for quicker trades like scalping, while longer time frames like daily or weekly charts might align better with swing trading strategies.
Remember, a higher risk tolerance might allow you to explore shorter time frames, while a more cautious approach might favour longer time frames. Regardless of your choice, SFP analysis can be applied effectively across various time frames.
Analysing bearish trades
This section dives into identifying and capitalising on bearish SFPs, using Ethereum (ETH) as an example. Remember, the concept applies to other tradable assets as well.
Identifying selling opportunities with SFPs
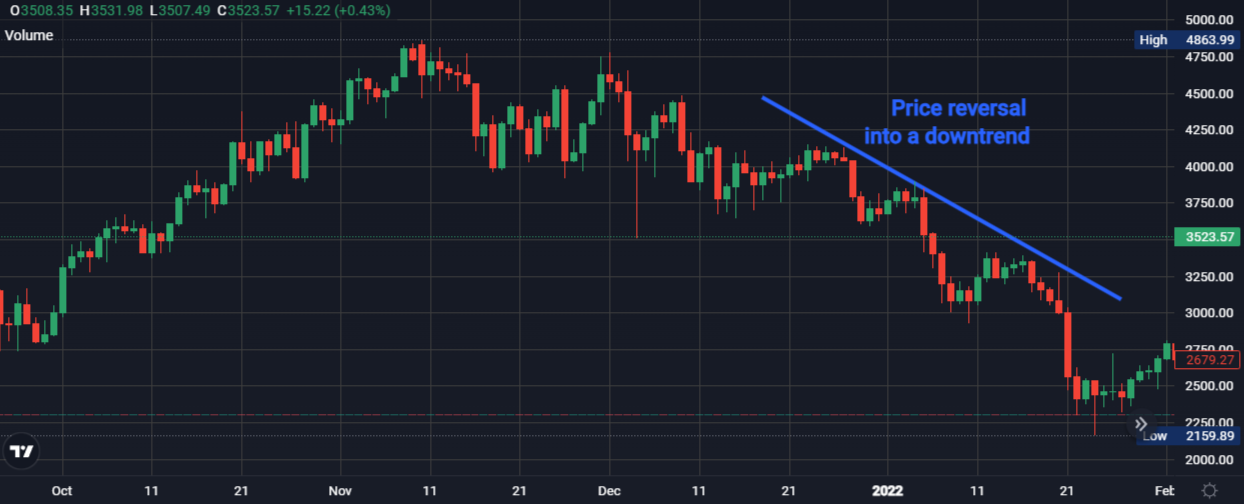
Bearish SFPs can signal potential downtrends, offering opportunities for short selling (profiting from a price decline). Let’s dissect a common scenario using the ETH chart below from PrimeXBT.
Uptrend
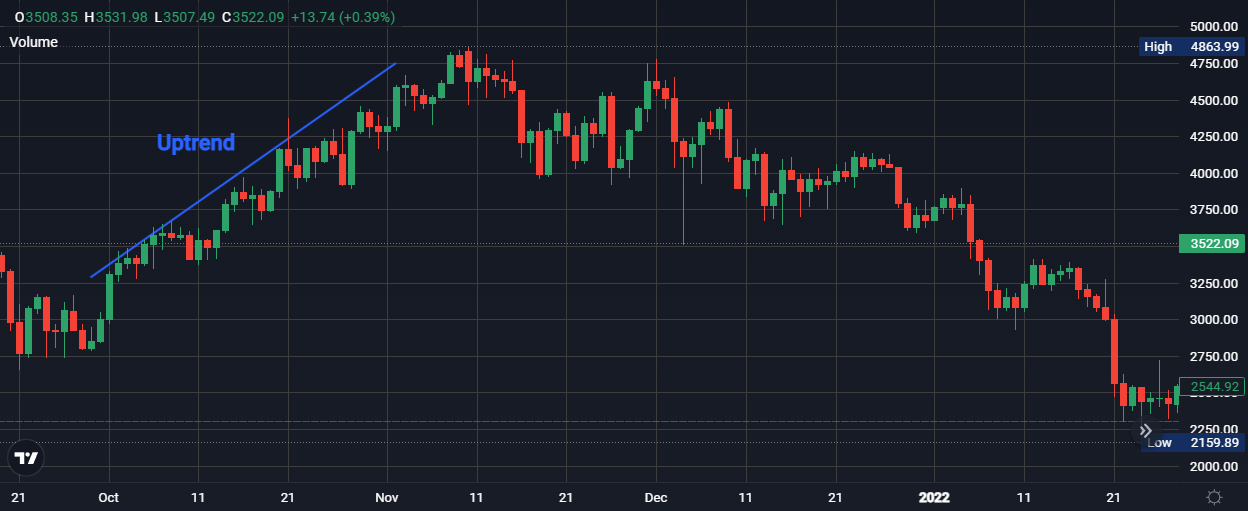
The initial stage often showcases price action in an uptrend, characterised by a series of higher highs and higher lows. This bullish price momentum entices buyers.
Price drop
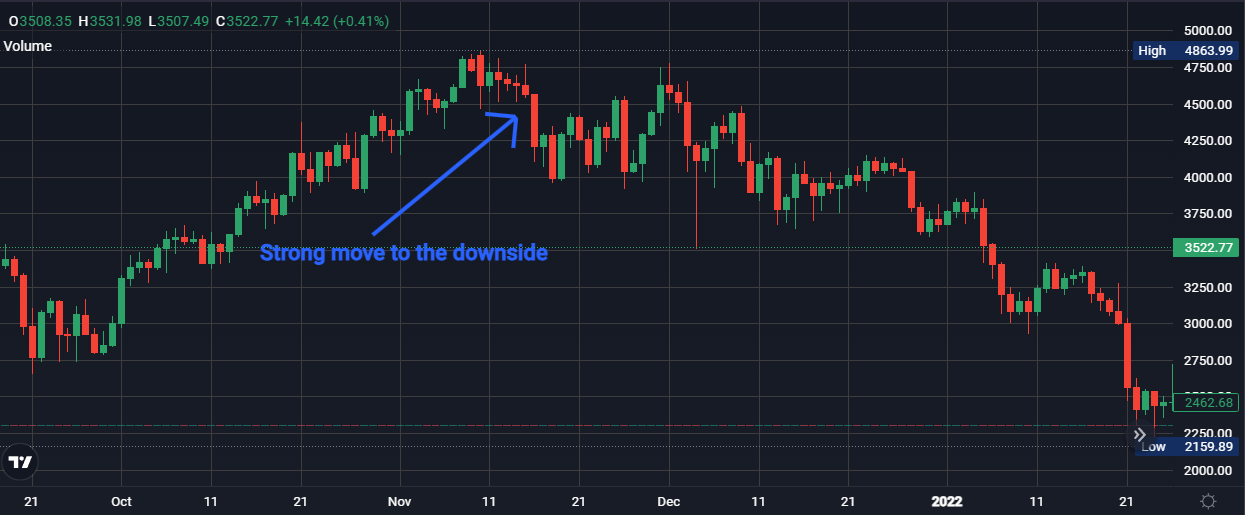
A significant price drop follows the uptrend, potentially indicating a shift in momentum. This could be due to various factors like selling pressure from profit-taking or changing market sentiment.
Failed breakout and downtrend confirmation
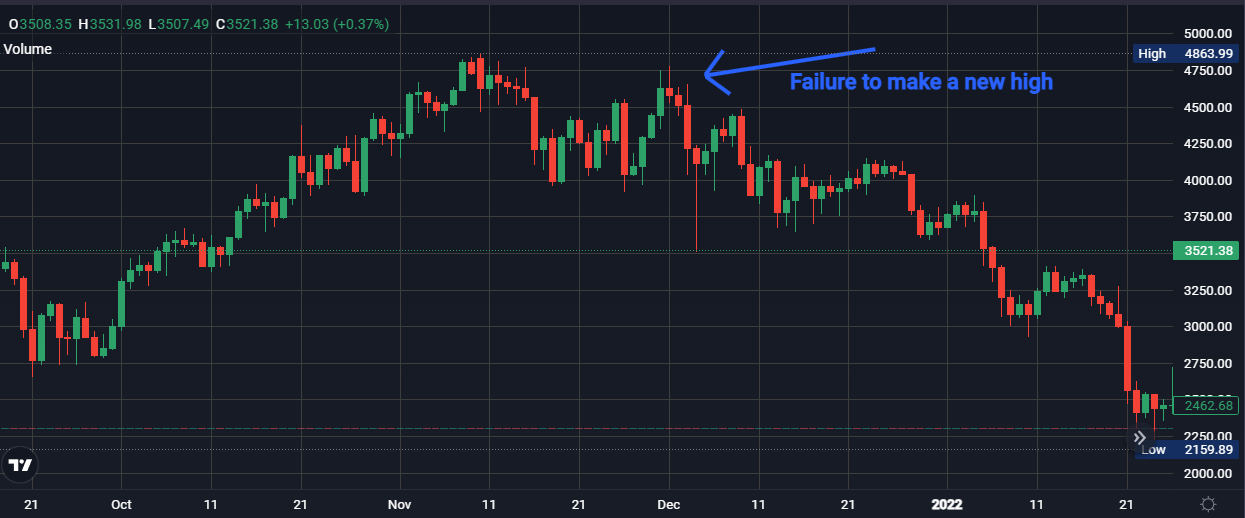
- Failed breakout: the price attempts to revisit the previous high (resistance zone) but fails to decisively break above it. This failed breakout is a crucial point of a bearish SFP. It suggests sellers are overpowering buyers at that price level.
- Downtrend confirmation: following the failed breakout, the price continues its descent. This downward movement confirms a potential trend reversal to the downside.
Confirmation and trade execution
- Confirmation: don’t rely solely on SFPs. Look for confirmation from other technical indicators, such as bearish divergence on the Relative Strength Index (RSI), before entering a short trade. Bearish divergence occurs when the price makes higher highs, but the RSI indicator makes lower highs, suggesting weakening bullish momentum.
- Trade execution strategies: traders may consider entering a short position below the failed breakout level (resistance zone). Remember, proper risk management is essential. Employ stop-losses above the failed breakout zone to limit potential losses if the price unexpectedly rises.
- Profit targets: potential profit targets for bearish SFP trades could include previous swing lows or support levels. These areas may indicate buying pressure that could halt the price decline.
Analysing bullish trades
Let’s also take a look at how traders can use bullish SFPs to identify buying opportunities.
Bullish SFPs appear when the price fails to push below a recent swing low, followed by a subsequent price move upwards. This pattern suggests a potential trend reversal from a downtrend to an uptrend.
Once you identify a bullish SFP, look for confirmation from other technical indicators before entering a long trade (buying). This helps to strengthen the signal and boost your confidence.
With a confirmed bullish SFP, consider a long entry above the swing high that follows the SFP formation. Remember, proper risk management is paramount. Use stop-loss orders placed below the swing low to limit potential losses if the price unexpectedly falls.
For profit targets, SFPs can offer guidance. Aiming for a previous swing high or resistance level can be a reasonable approach. These areas may indicate selling pressure that could halt the price increase.
Risk management and SFP trading
While Swing Failure Patterns (SFPs) can be a valuable tool for identifying potential reversals, successful trading hinges on proper risk management.
Market volatility is ever-present. Even SFPs don’t guarantee success, and the market can move unexpectedly. Stop-loss orders are essential to limit potential losses if the price moves against your trade.
Avoiding common mistakes
Even with SFPs in your toolkit, it’s important to be aware of potential pitfalls:
- False signals: not all SFPs lead to successful reversals. The market can be noisy for traders, and sometimes prices might test a level but not necessarily reverse. Confirmation from other indicators can help filter these false signals.
- Overconfidence: don’t let successful SFP trades lead to overconfidence. SFPs are a tool, not a guarantee. Always maintain discipline and stick to your trading plan.
- Confirmation bias: don’t seek out information that confirms your existing SFP bias. Analyse the chart objectively, considering both bullish and bearish possibilities.
- Ignoring risk management: SFPs don’t negate the importance of stop-loss orders and proper position sizing. Traders should always prioritise risk management to protect your capital.
By understanding these common mistakes, you can become a more well-rounded SFP trader.
Conclusion
Swing Failure Patterns (SFPs) can be helpful in identifying potential trend reversals. By understanding how to spot SFPs and incorporate confirmation strategies when using the SFP method on trading platforms such as PrimeXBT’s advanced trading platform, you’ll be better equipped to capitalise on these reversal opportunities.
However, remember that SFPs are not a crystal ball. The market is dynamic, and SFPs have limitations. Traders should always combine SFP analysis with other technical indicators and prioritise risk management practices to navigate the ever-changing trading landscape.
Consider this guide a springboard for further exploration of SFPs. There’s always more to learn in the world of trading, and mastering SFPs can give you an advantage in identifying potential trading opportunities. With a comprehensive trading platform like PrimeXBT that offers a variety of tools and resources, you can further enhance your technical analysis skills and make informed trading decisions.
The content provided here is for informational purposes only. It is not intended as personal investment advice and does not constitute a solicitation or invitation to engage in any financial transactions, investments, or related activities. Past performance is not a reliable indicator of future results.
The financial products offered by the Company are complex and come with a high risk of losing money rapidly due to leverage. These products may not be suitable for all investors. Before engaging, you should consider whether you understand how these leveraged products work and whether you can afford the high risk of losing your money.
The Company does not accept clients from the Restricted Jurisdictions as indicated in our website/ T&C. Some services or products may not be available in your jurisdiction.
The applicable legal entity and its respective products and services depend on the client’s country of residence and the entity with which the client has established a contractual relationship during registration.


