As the saying goes, markets never sleep. Not only do they not sleep, but they also never stop moving. Investors and traders usually use a graphical interpretation of calculations to analyse and even forecast market movements. These markings made on charts are called technical analysis indicators and are often used on the Stock market, Forex, Commodities, and Crypto markets.
One of the most frequently used analysis tools is the pivot point indicator. As the name indicates, the pivot point indicator forecasts potential levels and price reversals.
It was originally used by stock and security market floor traders. Surprisingly, this widely used indicator can be traced back to the early 1930s, and is credited to the now famous mathematician and trader Henry Chase. Initially, he created the analysis method to be used to analyse the security market. Of course, its exact provenance is contested and intertwined with other historical figures, including the legendary Jesse Livermore.
Pivot points are primarily used by short term traders, day traders, and swing traders – but the pivot point trading strategy is easily integrated into other systems and trading methods, and can be used across multiple timeframes.
The fundamentals of pivot points
As with most technical indicators, the assumption is that the market moves in cycles and that previous patterns or performances are repeated. If you can recognise those signs, or “signals” (which is the official term used in trading) then you can act accordingly. If it looks like the market is potentially reversing in a down trend, you can open a short position. If the signal is showing a potential bull trend, then you would open a long position.
But what is a pivot point indicator? It is a straightforward indicator, that averages three price levels; the previous closing prices, and the day’s high low prices or rates. And it’s purpose is to show the point where there is the potential for an asset’s trend to reverse.
You can use the simple formula below to calculate a pivot point using hight low and the previous day’s close.

From there, if the next day’s prices are moving above the pivot point levels, the trend is considered bullish, whereas if current prices are trading below the pivot point price level, the trend is bearish.
To calculate pivot points, you need to have the intraday closing price. This means the calculation needs to be done after the market has closed for the day, but before they open for next day’s trading session.
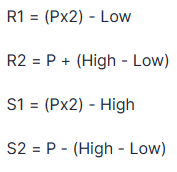
This information is also used to extrapolate support and resistance levels or regions. These are calculated by using the following formulas:
Calculating pivot points: a step-by-step guide
The standard pivot point formula
As you saw in the formula above, the first thing you need for pivot point calculation is to find the day’s highs and lows, and the previous closing rate.
Of course, this also means you need to wait until markets are closed and do it before the next trading day opens.
Then you will take the sum of these three prices and divide them by three.
Finally, you need to calculate your two support and resistance levels. For the first resistance level, take two times the base pivot point value and subtract it from the day’s low.
For the second resistance level, take the difference between the day’s high low and add that to the base pivot point value.
To calculate the first support level, again take two times the P value, and subtract it from the day’s high.
To calculate the second support level, inverse the second resistance’s calculation – i.e. the difference between the day’s high low, minus the value of the base pivot point.
If you need a visual representation, you can look at the formulas in the previous section. Once you’ve performed this calculation enough times though, it should become second nature and it’ll be simple to demark pivot points on a chart.
Other pivot point methods: Fibonacci, Camarilla, and more
As with most things in trading though, there are alternative methods to calculating pivot point levels.
If you are trading and have never heard of Fibonacci pivot points, or the Fibonacci indicator, as it is also known, then you might be missing out on a powerful technical analysis indicator.
How Fibonacci is calculated
Fibonacci pivot points also plot two support and resistance levels.
Or technically as many as you want, since it uses a sequence of steadily and progressively increasing values.
The next number in the sequence is a result of the sum of the two previous, for example, 1, (1+0=1),(1+1=2), (1+2=3), (2+3=5) etc.
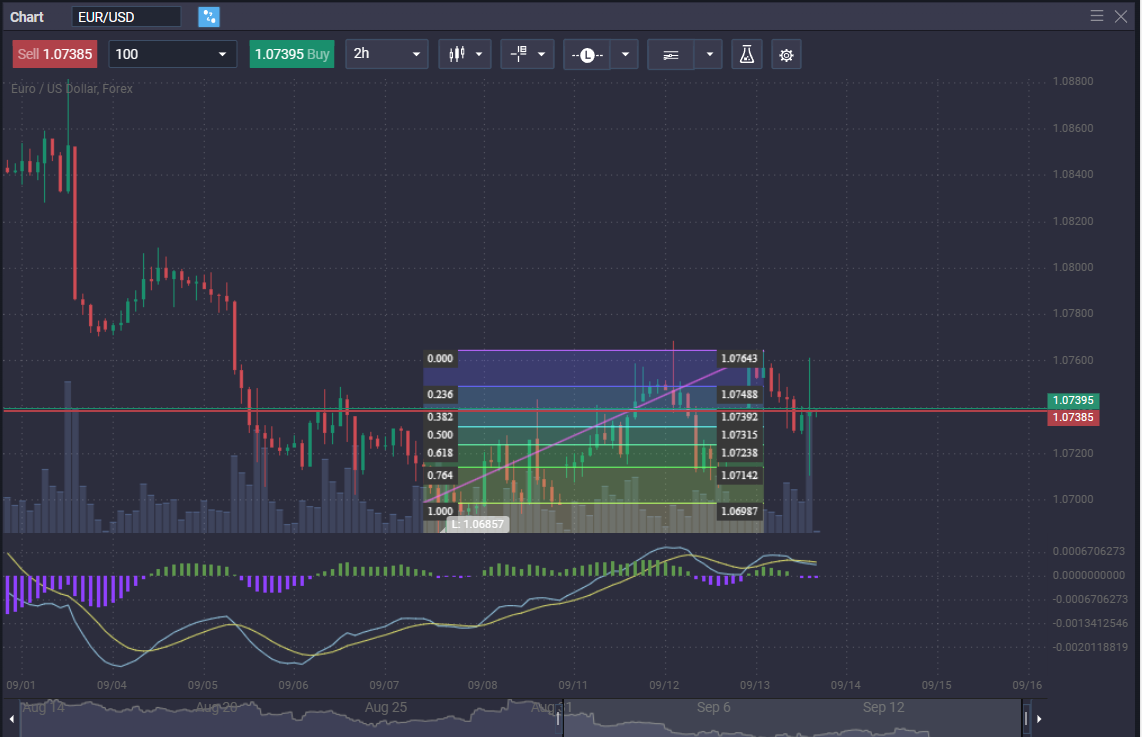
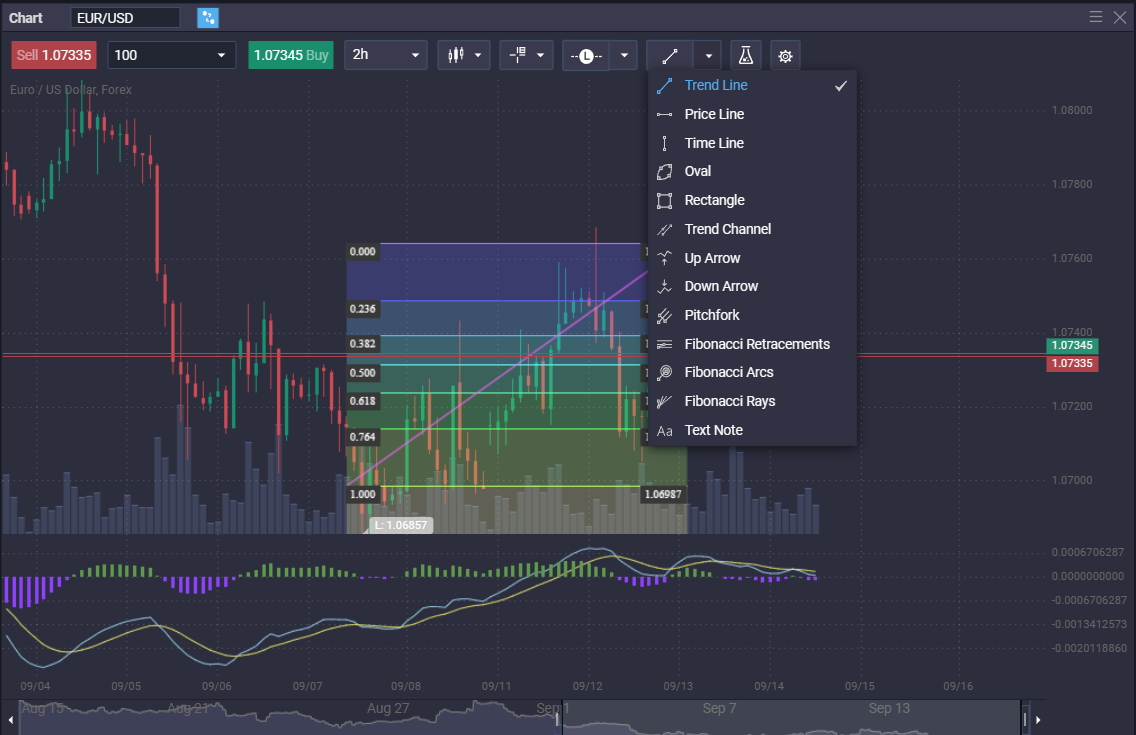
The Fibonacci pivot points or retracement levels are at 23.6%, 38.2% 61.8% and 78,4% of the prior price movement. Sometimes you may see 50% plotted on the line as well.
If you look at the chart below the levels are depicted as decimals or after they are divided by 100 – 0.236, 0.382, 0.50, 0.618, 0.784
The idea behind Camarilla pivot points is that prices tend to return to their mean until market forces make it break through that level.
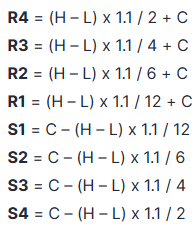
Follow the same method when you calculate pivot points, using the intraday high low and close of the previous trading day to define eight levels of support and resistance.
Here’s how this indicator is calculated.
Utilising pivot points in trading strategies
Identifying support and resistance levels
Support and resistance levels are the bread and butter of technical analysis traders. In simple terms, these are considered the two market forces which move an asset’s or instrument’s price.
And it’s all based on the markets’ cardinal rule – supply and demand.
When demand outpaces supply, an asset’s price rises. When supply outpaces demand, the value drops.
As the price of an asset climbs in value, investors sell off for profit until the supply meets demand, at which point the price stops moving. These are resistance levels.
Inversely, as an asset’s value drops, more buyers rush to purchase the asset at a lower price, at which point demand meets supply and support levels are created.
What happens when a breakout occurs
If the support and resistance levels are broken through, the old resistance level becomes a support level, and a new resistance level should be established shortly.
There are a few ways that traders use these key levels – some use them to confirm trends. If the price points have not yet tested resistance while in an upward trend, then there is still room for the price to increase.
If the asset is dropping in value and still has not tested resistance levels, then there is still a chance for its value to drop.
Another more risky way of trading is pivot point breakout, when the price breaks through either support and resistance levels.
When this happens support and resistance invert – when resistance levels are broken, it becomes the new support (if the trend continues), and when support is broken it becomes the new resistance (if the trend continues).
These are the principles pivot point trading strategy uses.
Combining with other technical indicators
Pivot point can be a powerful technical analysis indicator, but it’s always wise to confirm pivot point signals, with other indicators. Many traders have their own preferred collection of indicators they use to extrapolate future price levels or upcoming trends.
RSI is a popular technical analysis indicator as it shows if an asset is overbought or oversold over a specific period of time.
If it is overbought, the price is likely to drop back to its true market value, whereas if it is oversold, it should increase to meet its true market value.
Using this information, support and resistance levels calculated using pivot points, can give a trader valuable information regarding potential price action, including reversals or if a trend is likely to continue.
This can be especially appealing method for swing traders or day trading.
Moving averages, as the name indicates, is calculated based on the average of prices over a specific amount of time.
The periods they use are usually 20-day, 50-day and 200-day. You might see all three plotted on the same chart, with the shorter-period MAs moving closer to the chart prices.
To get the day’s price, traders use the high low close and divide it by three, but of the same day close not the previous close.
First, the most obvious information they yield is revealing if an asset is in an trending upwards or downwards.
Information is gleaned when the MAs of various timeframes cross each other. A bullish cross-over confirms an uptrend and happens when a shorter timeframe MA crosses over a longer timeframe MA.
When the opposite happens, i.e. a shorter MA crosses below a longer MA, a bearish crossover happens, confirming a downtrend – which an investor can use as a single for a short trade or as exit points for long positions.
Some even use standard pivot points to calculate their Moving Averages instead of the traditional high low and close.
Case studies: successful applications in trading
A strategy usually includes a timeframe, i.e. if you’re day trading, entry, exit points and where to place stop orders.
When using pivot points, traders may enter a trade at the middle line, and their stops at the leading indicators.
So in most cases, pivot points are used to plot support and resistance points, where stops can be placed or some even set them at the upper resistance level and lower support levels.
Keep in mind that as you deviate from the normal trading level with your stops, your risk increases, so this may skew your risk to reward ratio.
During your trading session make sure that support levels are confirmed (a general rule of thumb says that the price action needs to test levels at least three times to be considered confirmed).
In a hypothetical scenario, if you calculate your pivot point, but set your stop loss or profit targets at an unconfirmed level and the price moves in the opposite direction, it could cause rapid losses.
Again, you can use other technical indicators, beyond the standard pivot points, such as Fibonacci extensions, traditional support levels and MAs to confirm your levels.
Pitfalls and limitations of pivot points
Pivot points is an indicator that uses high low and closing price of the previous day, its scope can be limiting. Of course, you can further confirm these levels by comparing them to a previous low and the previous day’s high.
By comparing your levels to previous trading days’ high low and close, to your pivot points support 1, 2 and equivalent resistance levels, you can even calculate the percentage the price action was below or above your demark pivot points.
For example, if you are looking at EUR/USD and your pivot point is at 1.06650 you can calculate previous points. What is the percentage of time the pivot point was under the previous low? Or what is the percentage of time the EUR/USD pivot point was above the previous low?
This can give you an even more granular view of the potential price movement of the asset you are analysing or looking to trade.
The biggest drawback of almost all technical indicators, including pivot points, is the fact that they only use previous price action that happened during previous periods to extrapolate data.
This, unfortunately, disregards something that significantly affects market sentiment and, ultimately price action, news, upcoming releases and upcoming macroeconomic events.
Floor traders and day traders will be undeniably familiar with how even new product releases can affect a company’s stock value. Additionally, even scheduled events – such as earnings and yearly financial reports aren’t reflected in pivot point levels.
These events won’t be reflected in the data of the previous day or in any past timeframe.
Tools and resources for pivot point analysis
Trading platforms with pivot point indicators
Due to the simplicity of calculating them needing only high low and close, you can plot standard pivot points on almost any chart.
Just use the “trend line” tool found in most interfaces and then the “price tool” to create the horizontal support and resistance levels. In the image below you can also see Fibonacci pivot points plotted.
As stated previously, you’ll need the closing prices of the previous day, high low of the current trading day, and then divide their sum by three to see the pivot point.
From there, use the formulas above to demark pivot support and resistance. For new standard pivot points or the next pivot point, just repeat the process.
Learning resources and expert insights
As pivot points are such a popular indicator, there is a huge selection of educational resources teaching you how to use the pivot point strategy, how to plot pivot points on a chart, and how to use other indicators in combination with pivot points.
PrimeXBT Academy features an extensive library of materials about trading and the markets.
There are also various online recourses that include videos, ebook and articles related to analysing the markets using pivot points and their variations.
In addition, here’s a list of the best selling books relating to technical analysis:
- The Tao of Trading: How to Build Abundant Wealth in Any Market Condition
- Technical Analysis of the Financial Markets: A Comprehensive Guide to Trading Methods and Applications
- Trading: Technical Analysis Masterclass: Master the financial markets
- By John J. Murphy – Technical Analysis of the Financial Markets (2nd Revised edition)
- Technical Analysis: The Complete Resource for Financial Market Technicians
- Mastering Technical Analysis: Strategies and Tactics for Trading the Financial Markets
- Technical Analysis of the Financial Markets: 3 in 1- Comprehensive Beginner’s Guide+ Tips and Tricks to Make Good Money+Advanced Methods and Strategies to Master Trading and Financial markets
Conclusion: pivot points as an essential tool for modern traders
Pivot points are an invaluable tool for traders, no matter the market they choose to invest in. Using it in conjunction with other indicators such as Moving Averages and Fibonacci pivot points, can help give you even more valuable insight into market movements.
If you are new to trading then you can add pivot points to the set of tools that you will try, implement, and hopefully create a positive return on your portfolio.
Also, keep in mind that there is an extensive list of variations on the standard pivot points indicator, so keep researching, reading and refining the tools you use to analyse the markets.
Although pivot points are extremely valuable, there is one tool that surpasses all others – knowledge and experience.
What is the meaning of pivot point?
A pivot point is a mathematical calculation that helps traders analyse the market and hopefully forecast future movements.
What is a good pivot point?
A good pivot point helps you see what the potential trend is and gives you a base line to plot support levels and resistance.
Is pivot point a good indicator?
Pivot points are some of the most popular and widely-used indicators.
How do you use pivot points in Forex?
You can use pivot points to analyse markets and plot support and resistance, which are crucial when creating a strategy. Pivot point indicators can give you entry, exit and levels where you can place limit orders.
Do professional traders use pivot points?
Yes, institutional traders frequently use pivot points to analyse market movements.
The content provided here is for informational purposes only. It is not intended as personal investment advice and does not constitute a solicitation or invitation to engage in any financial transactions, investments, or related activities. Past performance is not a reliable indicator of future results.
The financial products offered by the Company are complex and come with a high risk of losing money rapidly due to leverage. These products may not be suitable for all investors. Before engaging, you should consider whether you understand how these leveraged products work and whether you can afford the high risk of losing your money.
The Company does not accept clients from the Restricted Jurisdictions as indicated in our website/ T&C. Some services or products may not be available in your jurisdiction.
The applicable legal entity and its respective products and services depend on the client’s country of residence and the entity with which the client has established a contractual relationship during registration.


