Pin bars are a powerful candlestick pattern used widely for reversal pattern trading across all financial markets. With their visually distinct shape forming at key support and resistance levels, pin bars act as early warning signals that a turnaround may be imminent.
This guide will provide a deep dive into all aspects of the pin bar strategy to show you exactly how to profit from these high probability setups.
What is a pin bar candlestick pattern?
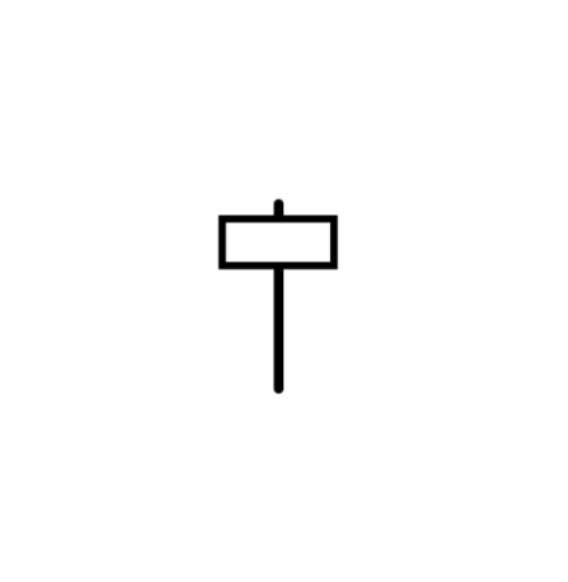
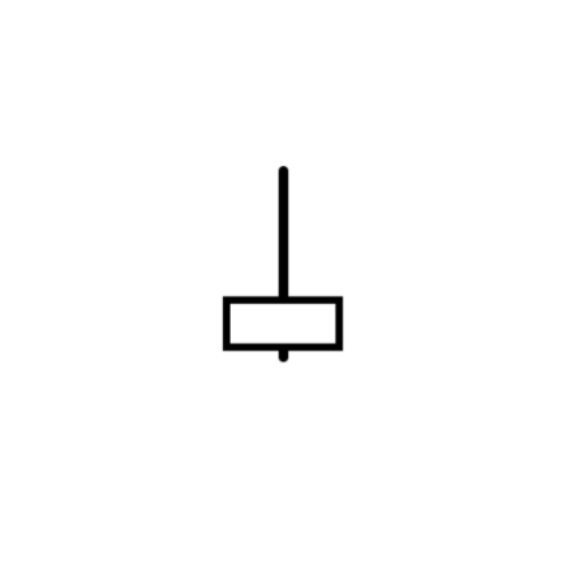
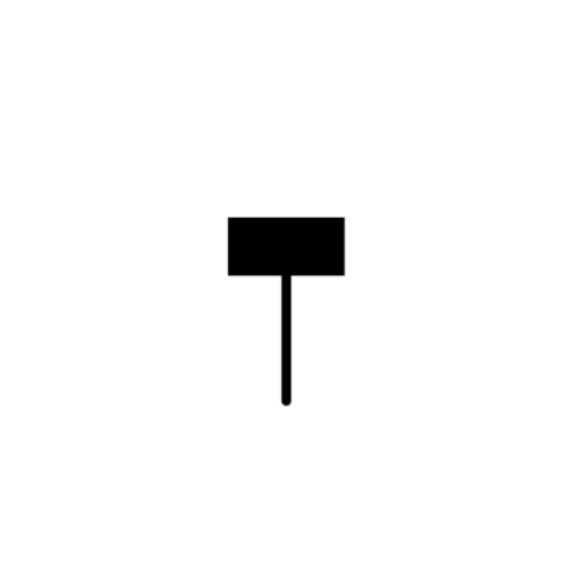
A pin bar is a candlestick pattern with a long tail or wick relative to its body size. It gets its name from the tail looking like a sharp pin or needle sticking out of the candle body. When this tail points against the prevailing price trend, it demonstrates rejection by market participants and hints at an impending change of sentiment and potential reversal.
Key characteristics
- Small real body at one extreme of candle range
- Long tail stretching out horizontally past body
- Tail shows rejection of an extreme price level
Pin bars tend to form at areas where the price was pushed to an extreme but swiftly rejected by buyers or sellers entering the market. This could happen at previously established support and resistance zones or trendline boundaries.
What does a pin bar trade setup signal?
Pin bars act as early warning signs of rejection which open up possible reversals or trend resumptions. Their message is that conditions may be ripe for a countermove against the recent price action.
However, pin bars require confirmation from the subsequent price action before acting as actionable trading signals. They indicate areas of interest for a potential turning point.
Identifying pin bars
Recognising bullish and bearish pin bar patterns
Pin bars at key support levels have a long lower tail and signal bullish rejection – the buyers stepped back in as the bears tried to push it lower. These hammer-like bottom pin bars show upside potential.
Conversely, pin bars at resistance with a long upper tail reflect bearish rejection from sellers – the upside attempt was swiftly rejected pointing to downside resumption.
Pin bar tail size
Ideally, the tail size should be at least 2-3 times the height of the real body portion of the candlestick to qualify as a textbook pin bar for highest probability setups.
Wicks vs shadows
The key tail portion is also referred to as a wick or shadow interchangeably. Just note whether it is the upper or lower wick/shadow that stands out.
Common mistakes in identifying a bullish and bearish pin bar pattern
Not every pin bar pattern works out. Invalid formations with insufficient tail size relative to candle body are likely false signals. Even valid pins can end up stopped out if no actual reversal occurs and the pin bar forms a continuation pattern in the existing direction instead.
Apply prudent risk management as pin bars are a probabilistic pattern, not a certainty. Consider market conditions and additional confirmation as part of your trading strategy.
Types of pin bars
Typically, pin bars are a single candlestick pattern. The candlestick forms based on opening and closing prices and usually have a small body and long wick.
Hammer
Hammers are a type of bullish pin bar pattern that form after a sustained downtrend, signaling potential capitulation at the lows with rejection pointing to reversal pattern up. Long lower tail reflects buyers stepping back in.

Shooting star
In contrast, shooting stars are bearish pins arising after a sustained uptrend, signaling bulls are losing control with distribution kicking in after rejection from resistance. Upper shadow reflects selling pressure.

Inverted hammer
The inverted hammer pattern has a long upper tail showing rejection following a downtrend. The pullback met renewed buying interest on retests. Signals potential bullish continuation reversal up from lows.

Hanging man
The bearish hanging man appears during a sustained uptrend, signaling the rally may be nearing exhaustion as sellers come back in on approach to resistance. Long lower tail reflects distribution.

How to trade pin bars: pin bar trading strategies explained
Now that you know how to identify a high probability pin bar setup, next comes the execution: entering pin bar reversal trades at opportune moments.
Entry techniques
Pin bars close outside the tail can trigger intra-bar entries on a market order as soon as the candle completes. Wicks showing rejection pre-close allow early entries.
Wait for next candle confirmation to fine tune entry and reduce whipsaws. Use limit orders to enter on retest of pin bar area or tail/body breach.
Stop loss placement
Initial protective stops are placed the other side of the pin bar tail/body to allow for wiggle room in case of slight breaches. Trail stop lower for upside breakouts and raise for downside.
Profit taking strategies
Take partial profits at a minimum 1:2 ratio to capture upside if reversal plays out while covering costs on the trade. For strong moves, let winning pin bar reversals run targeting up to 1:5 reward/risk with trailing stops.
Adding trend context
Combine with exponential or simple moving averages to confirm the market bias and only trade the pin bar pattern in direction of overall trend. This avoids troublesome false reversals and whipsaws against the tide.
Using other indicators
Additional indicators like the RSI oscillator add robustness in assessing overbought/oversold readings and divergences. Volume spikes confirm genuine rejection and interest at key levels.
Fibonacci retracements
Pin bars at Fibonacci retracements indicate pullbacks within the guardrails of underlying trends. These potential reversal signals in line with a key support level results in highest probability setups.
Other candlestick patterns and chart patterns
Consider surrounding price action to get a read on overall market sentiment. For example, if there is a false break of support at the bottom of a triangle, the reversal patterns could signal upward price movement and potential trend reversal. If price breaks below support, the pin bar was a bearish candlestick. Price action patterns of this nature can bolster trading strategies with additional context.
What is the pin bar combo pattern?
The pin bar combo pattern refers to the combination of a pin bar forming directly next to another candlestick pattern. Some examples include:
Pin Bar Inside Bar Combo
This is when a pin bar forms within the preceding inside bar, showing rejection simultaneously on two timeframes. It signals reversal potential at extremes.
Pin Bar Outside Bar Combo
Here a pin bar and outside bar (engulfing pattern) form adjacent to each other at swing points, combining signals to highlight major turning points.
Pin Bar Doji Combo
When a doji candle shows market indecision right next to a pin bar at support/resistance, it reflects hesitation to push further extremes hinting at imminent reversal.
Pin Bar Channel Break
A pin bar appearing outside Bollinger Band channel boundaries or at trendline breaks signals rejection of extreme levels and likely reversion ahead.
Pin Bar Harami Combo
The harami candlestick pattern next to a pin bar increases the chances of a meaningful turnaround as both show reversal signals in tandem at key zones.
Advantages and limitations of the pin bar reversal pattern
Advantages
Provides clear visual signals
The long protruding wick or tail makes the pin bar pattern easy to identify visually on the chart. Even novice traders can spot them and understand their significance as signs of rejection and impending reversals.
Universal across markets
Pin bars form reliably across all liquid markets including Forex trading, Stock Indices, Commodities, and Cryptocurrencies. Their patterns reflects human emotion and psychology – making them a robust leading signal across diverse assets.
Signals momentum shifts
The long tails signify rapid rejection and failed breakout attempts – hinting at substantial shifts in market momentum as sentiment changes quicker than recent price action suggests.
Versatile for any time frame
Intraday scalpers can trade pin bars successfully on 1-minute charts while long term investors spot them on weekly charts. Versatile across timeframes make them universally applied regardless of trading style.
Works well with other technical indicators
Pin bars work exceptionally well when combined with oscillator readings of overbought/oversold, moving average crosses, Fibonacci retracements, volume spikes and other confluence tools that strengthen overall signal reliability.
Limitations
Prone to false signals
While pin bars demonstrate areas of interest, they do not provide absolute certainty on reversals. The subsequent price action can stop out the signal, resulting in false triggers and failed setups. Not every pin bar acts as expected.
Requires additional confirmation
To avoid premature entries on false signals, pin bars work best when confirmed by the next candle closing respecting the pin’s high/low boundary or tail/body portion. Wait for follow through before acting.
Can result in whip-saws
Similarly, placing stops too close or aggressively trading pin bars without allowing some wiggle room can result in stops being hit, only for the price to reverse as originally expected. Give the setups space to play out.
Depends on context
A pin bar candlestick pattern should be traded in confluence with the predominant market structure, directional bias, and technical levels. Going against the primary trend solely on a pin bar tends to end badly. Context is crucial.
Not a complete system
Beginners often assume you can simply trade every pin bar. But like any single pattern, pin bars are best coupled with a structured approach and robust risk management for long term trading success rather than relying on them exclusively.
Practical applications
Pin bars become exponentially more effective when applied strategically in confluence with other technical analysis tools and frameworks for greater context and confirmation.
Pin bars with support and resistance levels
Pin bars form most convincingly at established support and resistance zones where they confirm serious buying or selling interest. This makes SR indispensable for spotting high probability setups.
Finding SR levels
Mark horizontal lines where prior price peaks formed barriers and price bottoms provided footing. These become key SR levels the market respects. Zoom out to a higher time frame to spot the most significant levels.
Combining pin bars with SR
When pin bars signal rejection precisely at known SR zones, it demonstrates these key areas are still very much in play and adds greater weight to the setup as both indicators align around pivotal price points.
Entering trades at SR
Use limit orders to enter on a retest of SR with a pin bar present. The confluence provides defined trade location, sensible stop loss placement bel
Pin bars and trend analysis
Since pin bars signal potential reversals, they carry greater significance when they form in the context of the primary trend structure. Trading pins in line with the dominant trend improves odds substantially.
Using moving averages
Determine the trend bias using key daily moving averages like the 50 and 200. Pin bars appearing in alignment with the major MA direction offer higher probability setups. Go long on bullish pins above rising MAs.
Trading the pullbacks
Markets move in waves – use pins arising on pullbacks within existing trends for lowest risk swing entries. These offer clearly defined stop levels with upside to resume the dominant directional move.
Inside bars and outside bars
Combining pin bars with inside/outside bars adds confirming pattern confluence at potential turning points in the trend. These double & triple pattern combos spots highly lucrative reversal setups.
Pin bar trading strategies
Pin bar scalping strategy
For short-term traders, the 1 minute chart pin bars combined with key levels provide precision entries to scalp the markets. Define risk with stops beyond the pin high/low to capture 5-15 pip movements.
Combining pin bars with other indicators
Oscillators like RSI & stochastic reaching oversold/overbought zones reinforce the pin bar reversal signals at extremes. Similarly, bullish/bearish divergences with pins spotlight high probability setups.
Conclusion
Pin bars are most effectively traded as part of a structured technical approach, in alignment with the underlying market structure. Combining pin bars with key resistance or support zones, moving average trend analysis and oscillators produces a robust framework to profit from these high probability trading setups.
What is a pinbar candle?
A pinbar candlestick has a large protruding tail (wick/shadow) compared to its small body, giving it the appearance of a needle or pin. This long tail demonstrates rejection of an extreme price level where the market tested then swiftly reversed from.
Is a pin bar bullish or bearish?
Bullish pin bar patterns form after a decline with large lower tails reflecting buyers stepping back into the market rejecting low prices.
Bearish pin bars form after a rise, with the long upper tail showing sellers coming in, rejecting the high prices.
What is the difference between a pin bar pattern and a hammer?
Essentially they are the same pattern. The hammer refers specifically to the bullish pin bar variety with the longer lower tail. So hammers are a type of bottoming pin bar showing bullish rejection of lows after a downtrend.
What is the difference between pin bar pattern and inside bar?
Inside bars have their entire body and tail contained within the range of the previous candle showing consolidation and indecision. A pin bar candlestick pattern has a pronounced tail extruding past the range of many recent price bars showing market rejection.
What does a pin bar candle mean?
A pin bar candlestick signals rejection by either buyers or sellers at an extreme price point. The long wick shows where the market pushed into an area but then swiftly reversed from that level indicating shifting sentiment ahead, making pin bars an early warning reversal signal.
So in essence, a pin bar pattern shows the market tested and rejected an extreme price level and their tails reflect the failure of the move which opens up reversal potential as momentum falters. The long tail is created when orders pour in opposite to the direction the price was heading, causing it to whip back rapidly.
The content provided here is for informational purposes only. It is not intended as personal investment advice and does not constitute a solicitation or invitation to engage in any financial transactions, investments, or related activities. Past performance is not a reliable indicator of future results.
The financial products offered by the Company are complex and come with a high risk of losing money rapidly due to leverage. These products may not be suitable for all investors. Before engaging, you should consider whether you understand how these leveraged products work and whether you can afford the high risk of losing your money.
The Company does not accept clients from the Restricted Jurisdictions as indicated in our website/ T&C. Some services or products may not be available in your jurisdiction.
The applicable legal entity and its respective products and services depend on the client’s country of residence and the entity with which the client has established a contractual relationship during registration.


