Technical indicators are like potatoes. Almost everyone likes them, just in different ways, some even enjoy the liquid type. Continuing the potatoes allegory, if Bollinger Bands were French fries or chips as the rest of the world calls them, then Keltner Channels are curly fries – which ironically are also called curly fries in the land of Shakespeare, not curly chips if you assumed they followed the same idiomatic pattern.
Unlike potatoes, though, technical indicators are extremely powerful trading and investing tools that can help market participants confirm trends, forecast market conditions, delineate (and limit) market exposure, see volatility and even predict market movements.
The users of Keltner Channels, like fans of curly fries, believe they are far superior to the other types of bands (or potato preparations), including Stochastics, MACD and Bollinger bands.
Are they right, though?
To a certain extent. Keltner Channels, as with all technical indicators, are best used with other trend following indicators, or volume and momentum indicators.
You will frequently see RSI, MAs or MACDs used in combination with trend channel line indicators.
Let’s take a look at this very useful indicator and how it differs and maybe how it’s better than other trend following indicators.
What is the Keltner Channel?
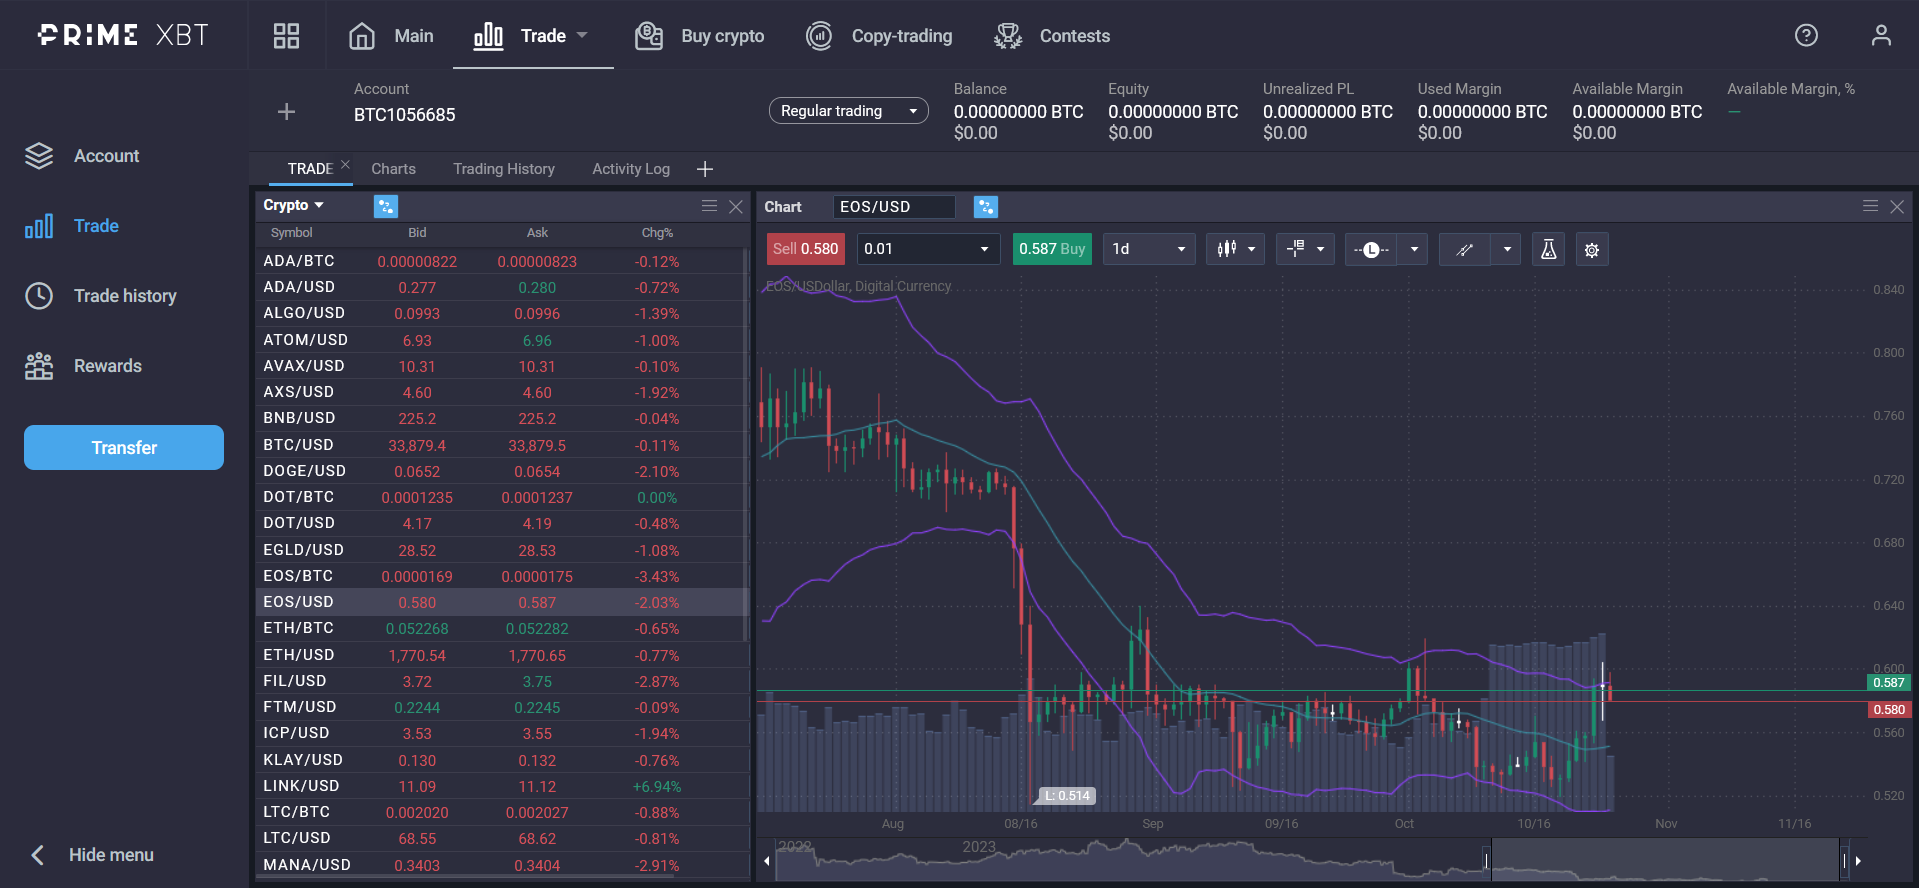
Keltner Channels are composed of three lines: the upper channel line is a moving average of the highs, and the lower channel line, is a moving average of the lows, both are a standard deviation from a middle line (which is also a moving average) calculated using the Average True Range ATR.
Average True Range ATR is calculated by taking the average of true ranges over a predefined period – usually 14 timeframe intervals.
True range is like the average of a range but takes into consideration the gaps between candlesticks or bars.
Theoretically, not only does this show the trend direction but also momentum and market conditions or volatility.
That may seem like a mouthful, but luckily most modern trading platforms and interfaces feature this indicator in their default settings, like PrimeXBT’s platform seen above.
Components and calculation of the Keltner Channel
Moving Averages
Keltner channels are based on Moving Averages or MAs as most technical traders call them. Initially, these calculations where used by Stock traders to identify trends, but eventually, due to their utility, they were adopted by people who traded other markets as well.
The concept behind MAs is that by averaging the price of an asset’s price, smaller momentary corrections or fluctuations are “smoothed” out, giving the technical trader a clearer picture of the current market conditions.
There are two types of MAs generally – the Simple Moving Average and the Exponential Moving Average EMA. The Simple Moving Average, as the name indicates, averages an asset’s prices with equal weight.
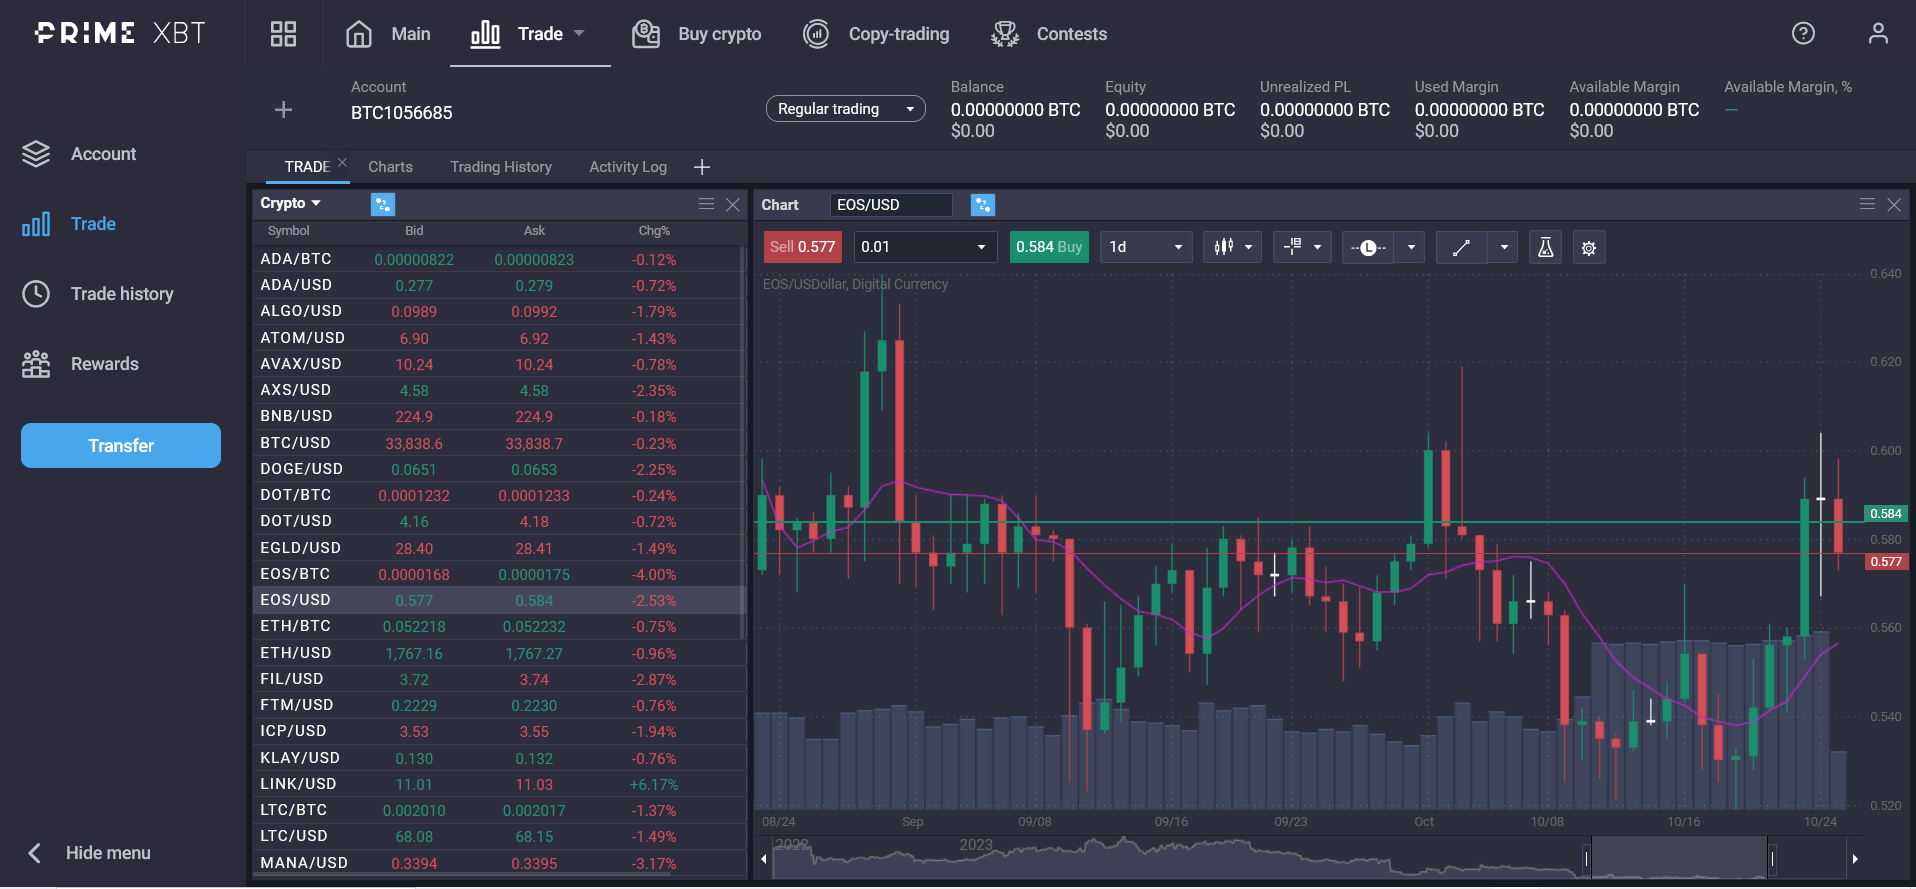
The Exponential Moving Average places greater emphasis on more recent price movements during it’s calculations.
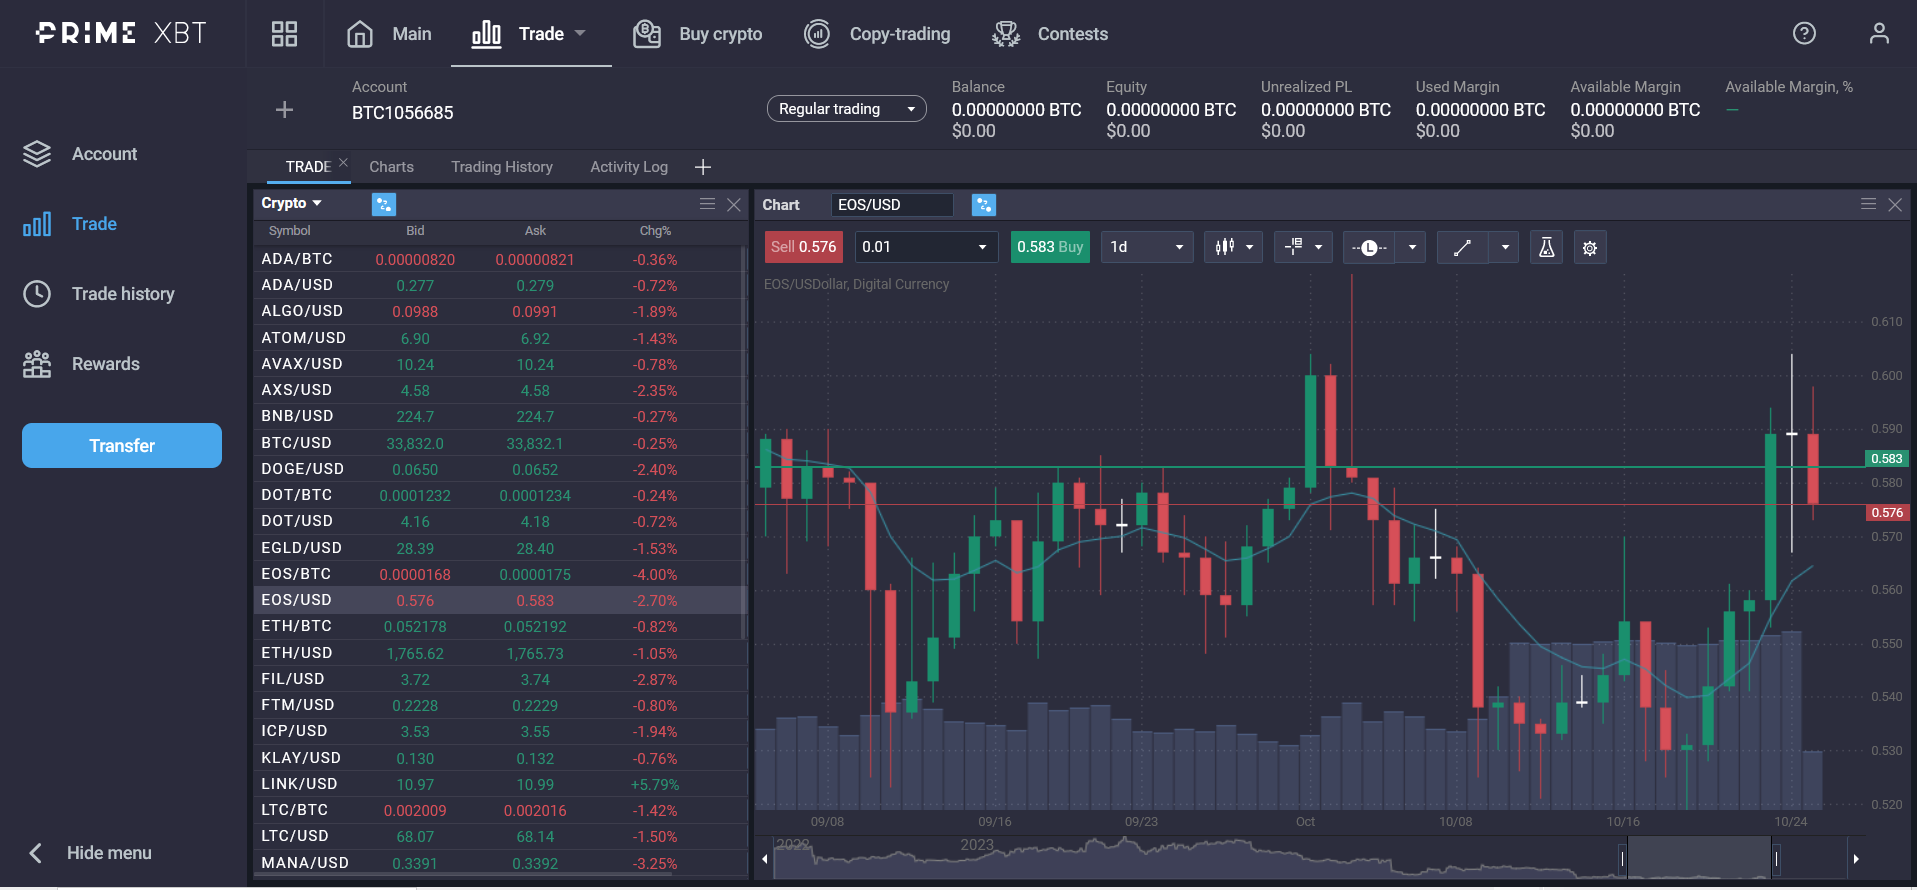
The two charts above display the same asset EOS/USD over the same timeframe. As you can see the SMA (simple moving average) is smoother and doesn’t follow peaks and dips as closely as the EMA.
You can see this emphasis on candlestick number 9 and 10 from today’s price where the SMA smooths that price peak completely (the ninth and tenth candlestick from the right).
Volatility measurements
Depending on market conditions, Keltner Channels may be used to identify overbought and oversold levels or support and resistance. You can see this happening in the range of prices around the green and red arrows below.
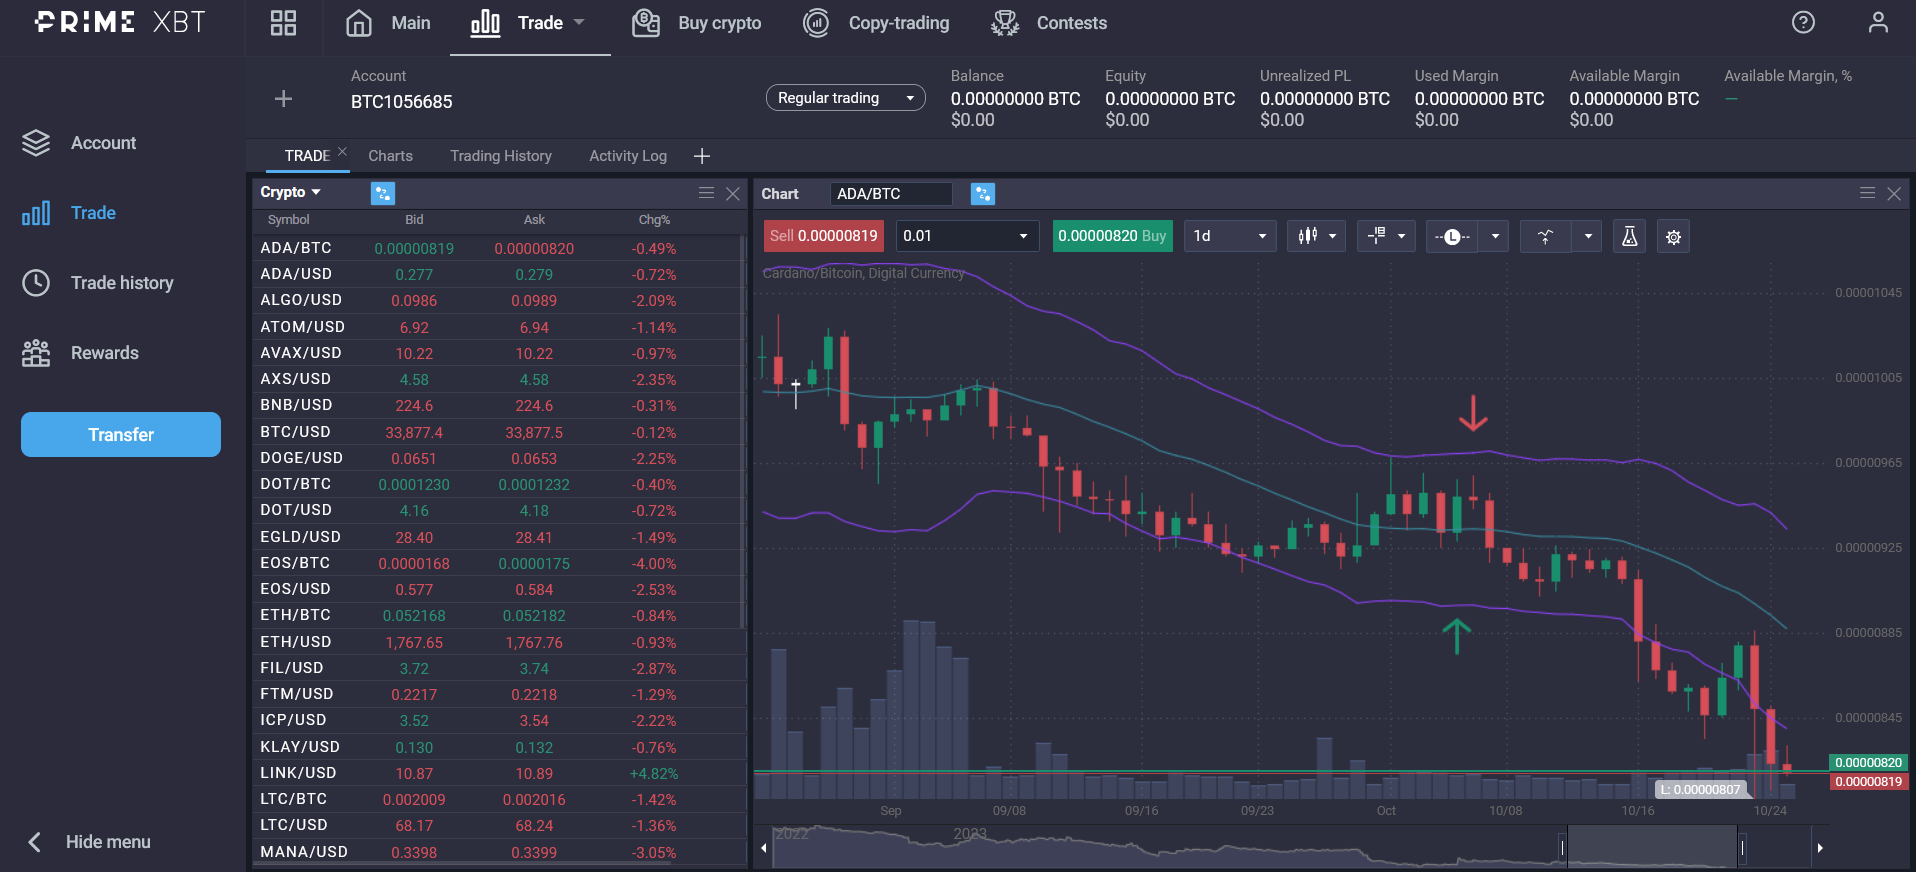
Of course, in the specific example the middle line acts as support instead of the lower channel line, but this can also yield valid and accurate results as you can see from the breakout and the middle line then becoming the resistance line.
Beyond the information you can glean from the Keltner Channel indicator, as the channel lines expand and contract, you can also see market volatility. In fact, you may see the Keltner Channels called a volatility based indicator.
You will see the channel lines expand and contract in response to volatility. If you are new to trading let me remind you that when volatility increases, the possibility of abrupt price movements or even price breaks.
Setting up the Keltner Channel on trading platforms
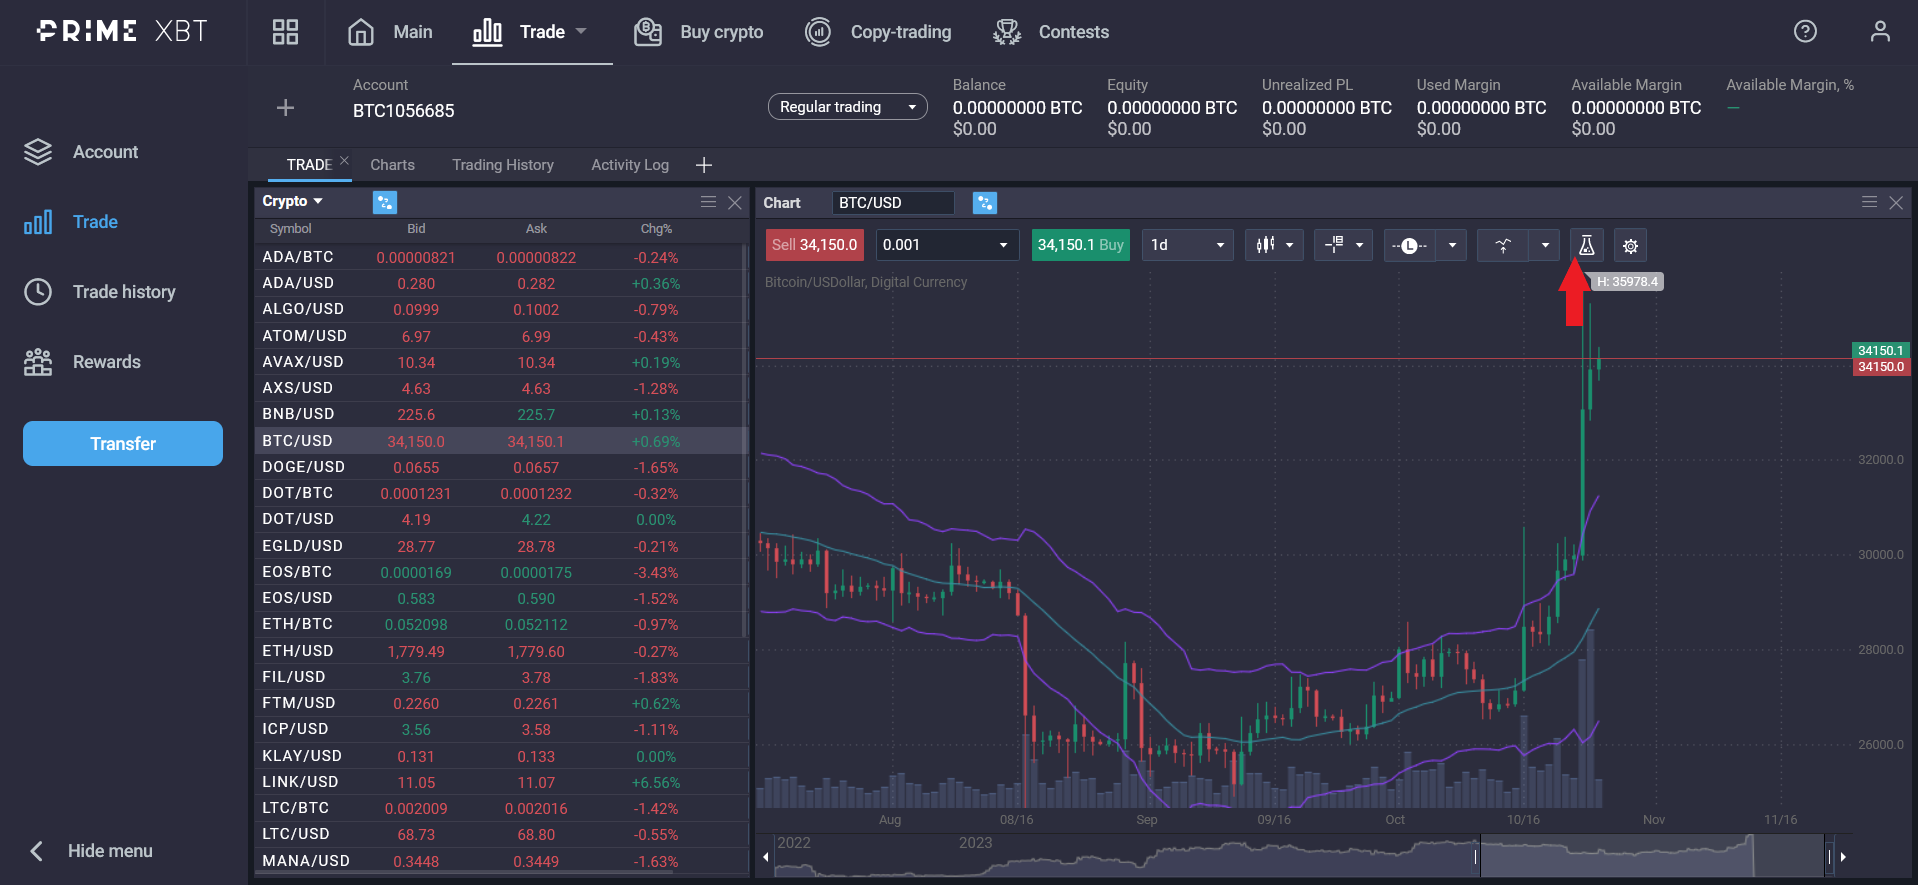
As mentioned above, PrimeXBT’s online platform offers an extensive list of indicators that you can use quickly and easily – because who has time for formulas and calculations?
Simply click on the “beaker” icon (indicated by the red arrow in the image above). This will give you a popup with all the available indicators, and it’s quite the list! Scroll down until you find Keltner Channels (again indicated by a red arrow).
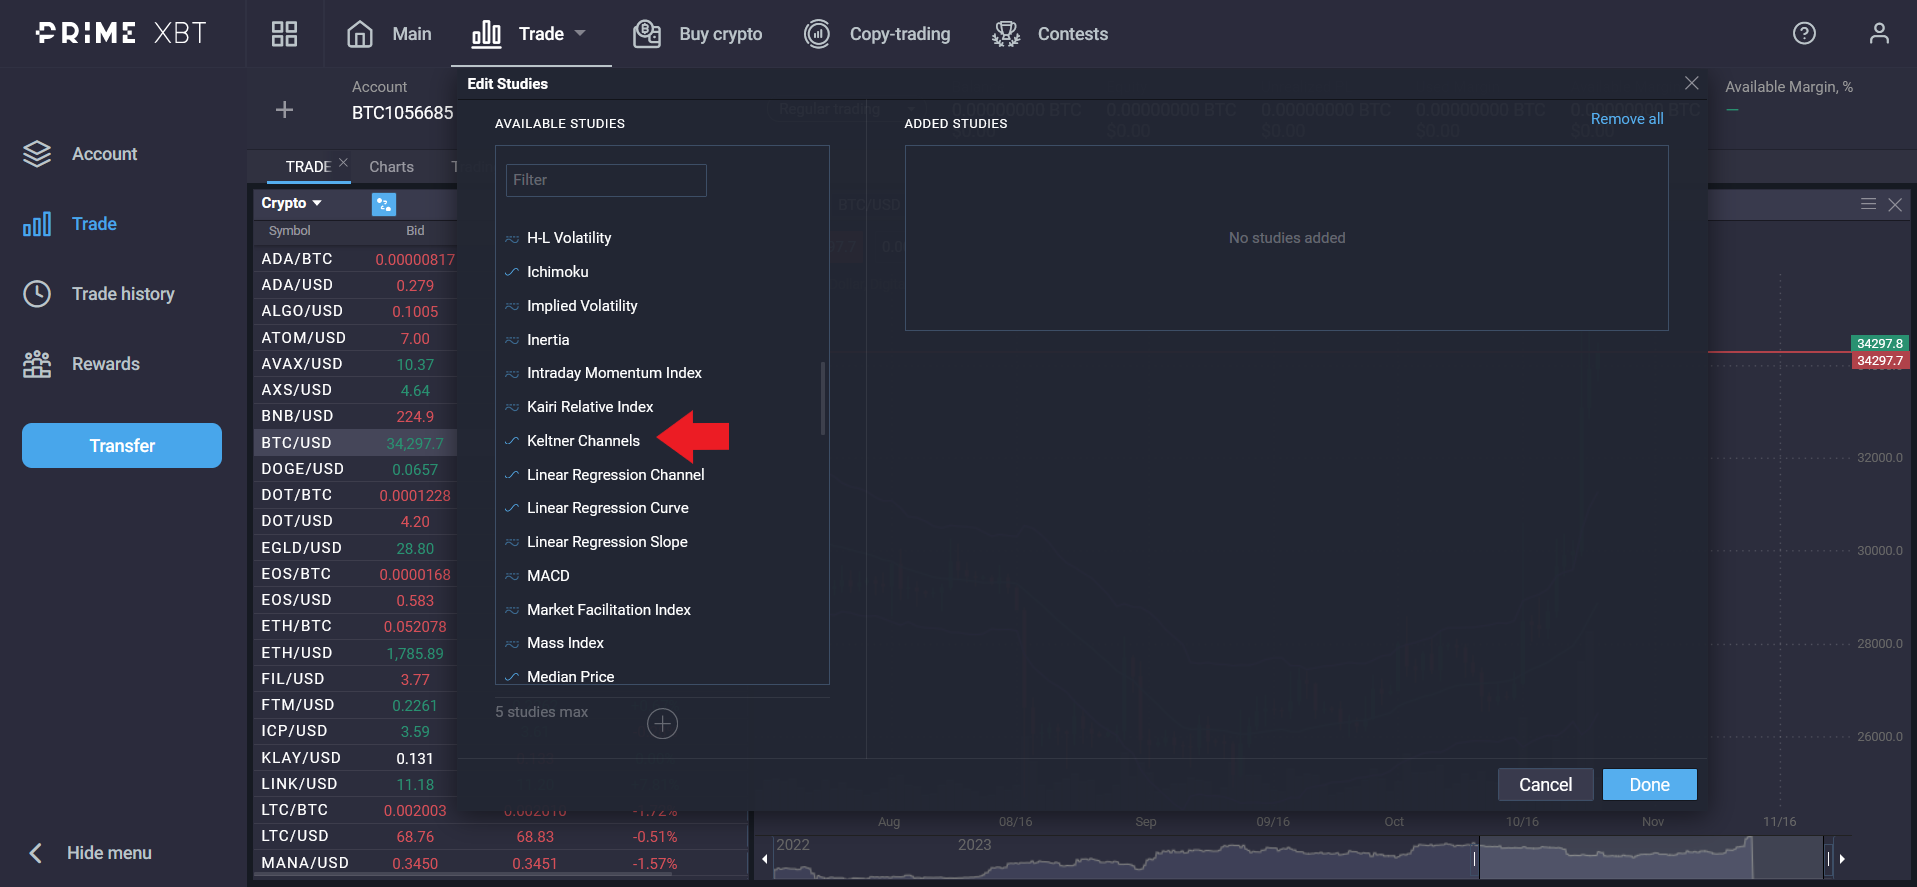
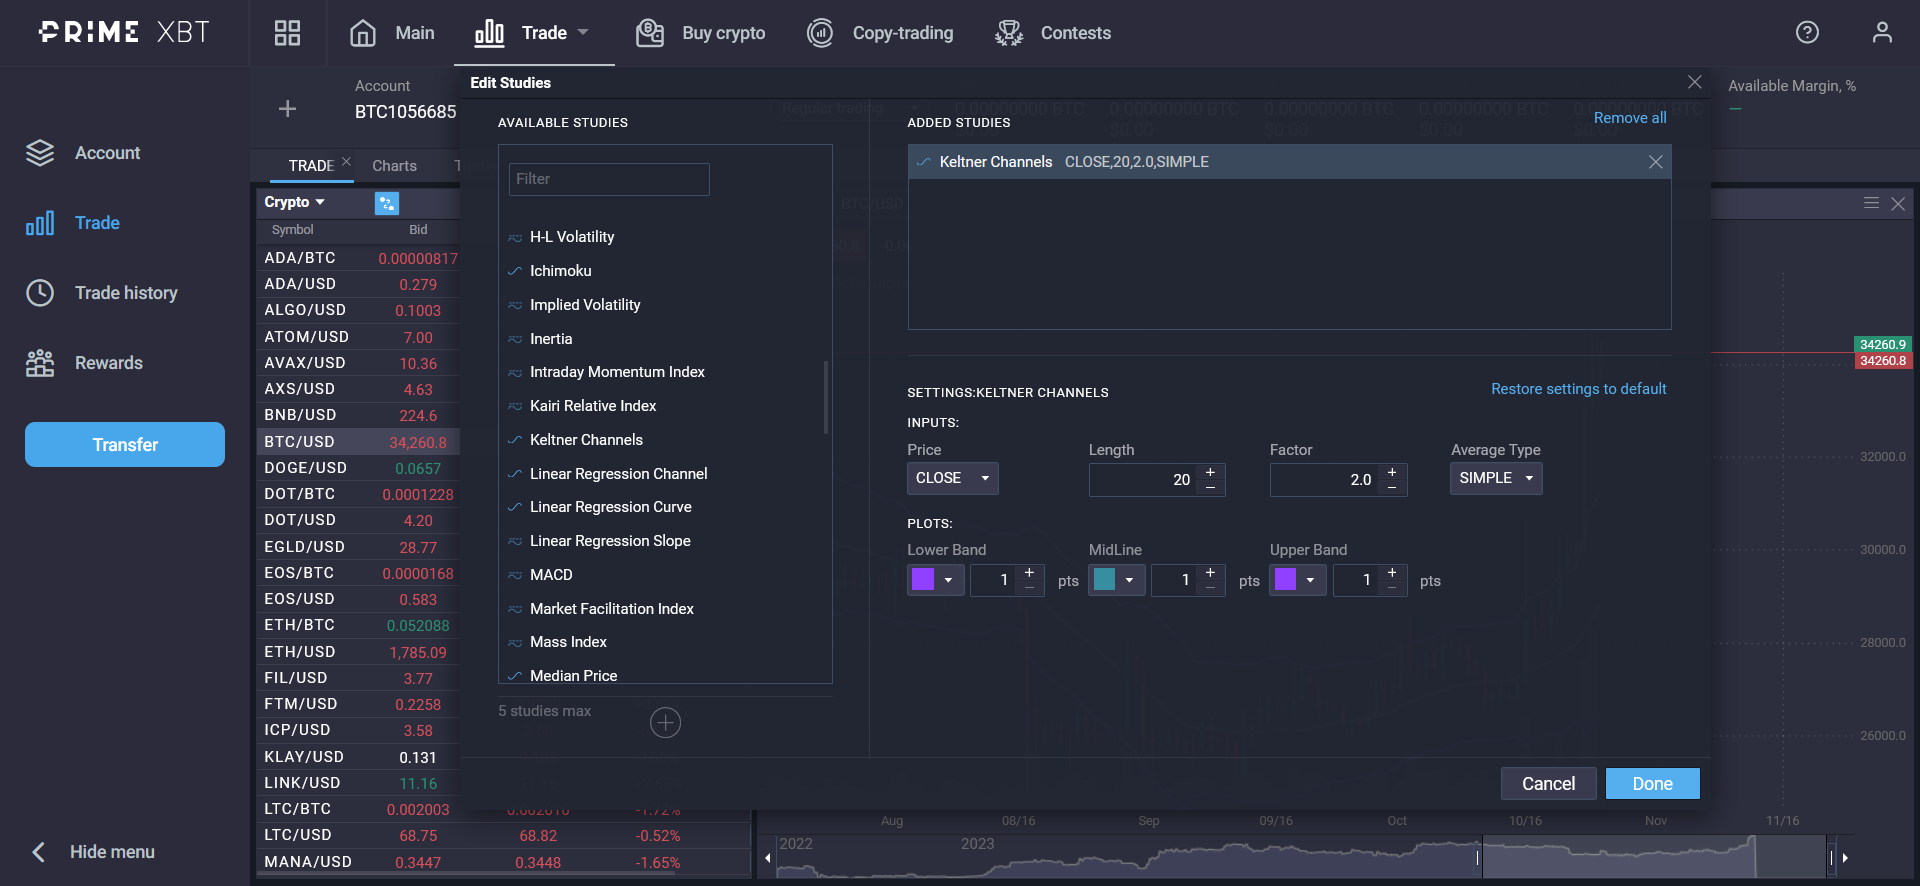
Now you can double click on the indicator to load the options that you can adjust or apply the default settings.
When you click “Done” the indicator will be applied to your chart.
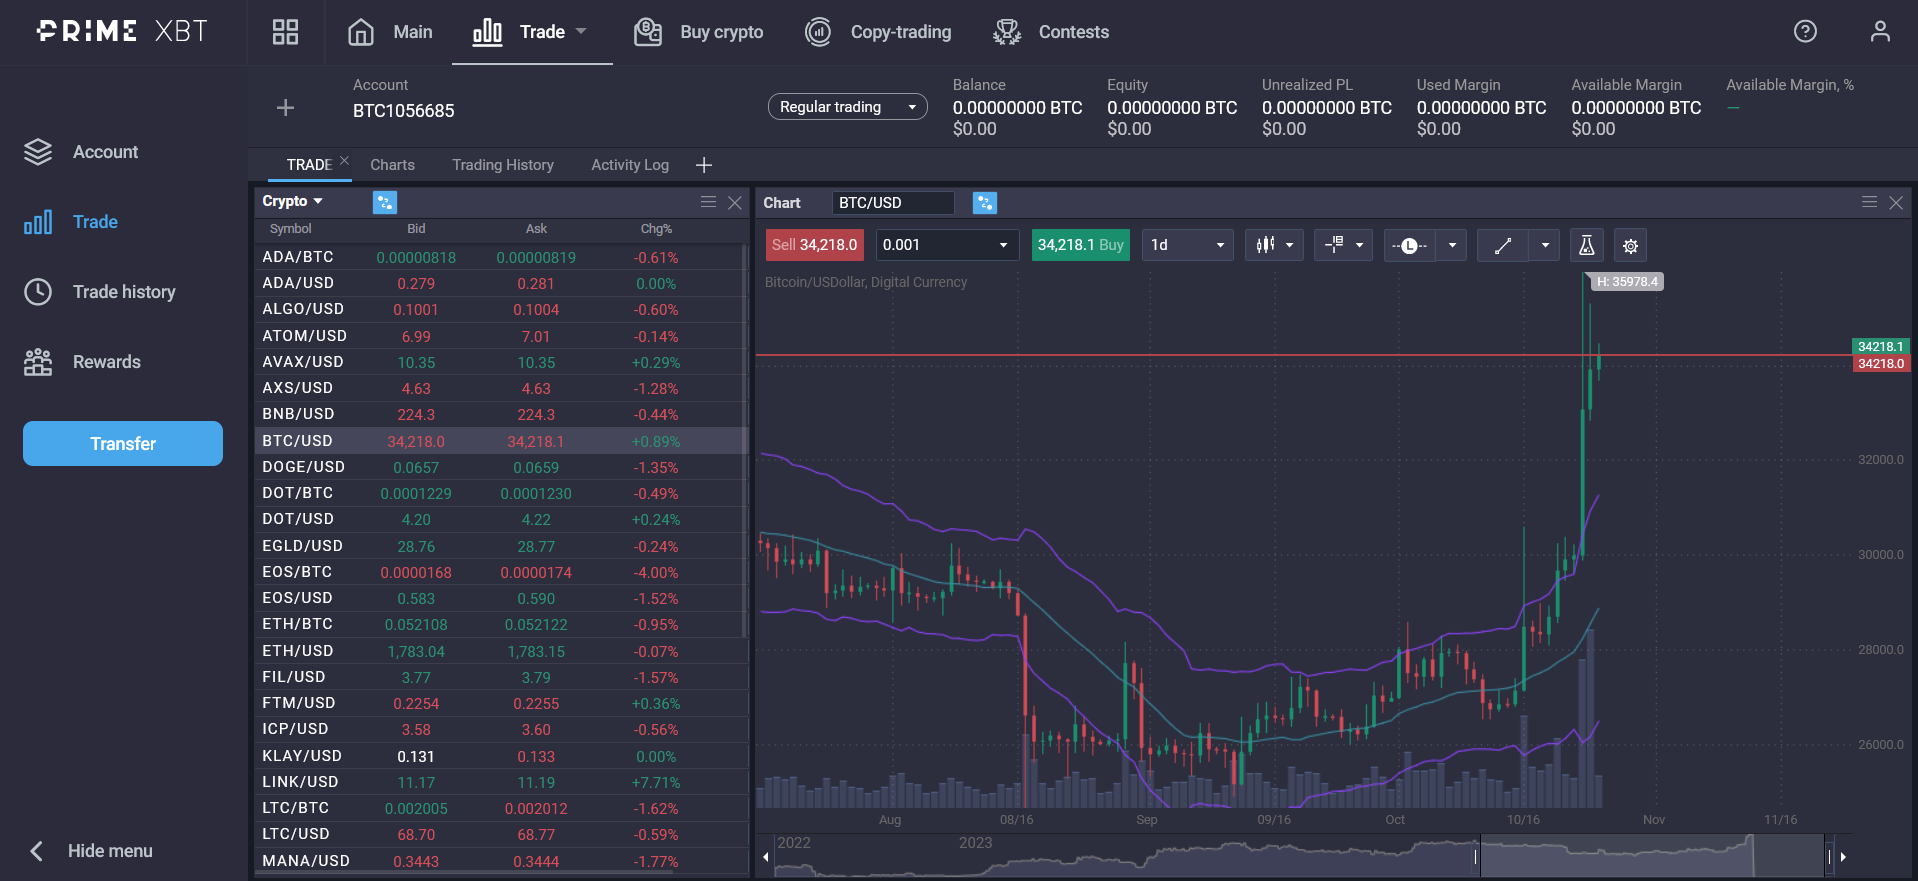
The default settings, and this is true no matter the platform, is an exponential moving average EMA, set at a 20-period timeframe, the upper and lower channel lines are calculated respectively: the 20 EMA + (2 x Average true range ATR) and the 20 EMA – (2 x ATR).
You can adjust the variables to best fit your strategy and the timeframe that you are trading with.
Keep in mind that Keltner Channels are most effective over the medium and short term.
Interpreting Keltner Channel signals
When employing the Keltner Channels in your trading analysis, there are a few signals that you can look for.
Most of them happen when the price breaks the upper channel line, the lower channel line or the middle Exponential Moving Average EMA line.
We’ll go through a few of the potential and most common scenarios that you may encounter when using the Keltner Channel indicator.
Trend identification
The most obvious use-case scenario when applying the Keltner Channel indicator is trend identification. If the price is banded between the upper and lower channel lines, and they are moving upwards, this is a clear indication of an uptrend.
If the prices are banded between the lower and upper channel line, and the channel is moving downwards, then there’s a downtrend following.
But there’s a bit more to this story: channel breakouts indicate a trend continuation pattern. If the channel direction is going up and the price breaks through the upper line, then the uptrend is likely to continue.
The same is true if all the prices and channels are in the same direction but moving downwards and the price breaks the lower line.
Overbought and oversold conditions
Further proving the power and ease of use of the Keltner Channel indicator is the ease at which a trader or investor can see if the asset being analysed is approaching overbought and oversold levels.
The asset approaches overbought status the closer it gets to the upper line of the Keltner Channel.
When the asset’s price approaches the lower line of the Keltner Channel, it gets closer to being oversold.
The way a trader can use this information is to understand when a possible trend reversal will happen.
It is assumed that an asset will always return to its true market value when it experiences oversold and overbought conditions. As the terms imply, when an asset is overbought, it will drop to reach its intrinsic value, and when it is oversold, it will “climb” back to its real market value.
Keltner Channel trading strategies
There are numerous strategies that can work with Keltner Channels, but most are short and medium term ones, as Keltner Channels work best within that timeframe.
There are conditions that you should look out for when you use Keltner Channels.
- Price is above both the middle line and upper channel line.
- Price is above the Exponential Moving Average but below the upper band.
- The price is below the central Moving Average line, but above the lower band line.
- The price is both below the middle line and the lower band line.
Keep in mind that breakouts beyond the upper and lower bands, aren’t necessary trading signals, but can be false signals that either need to confirmed using other indicators or by waiting for the trend to full emerge.
Trend pullback trading strategy
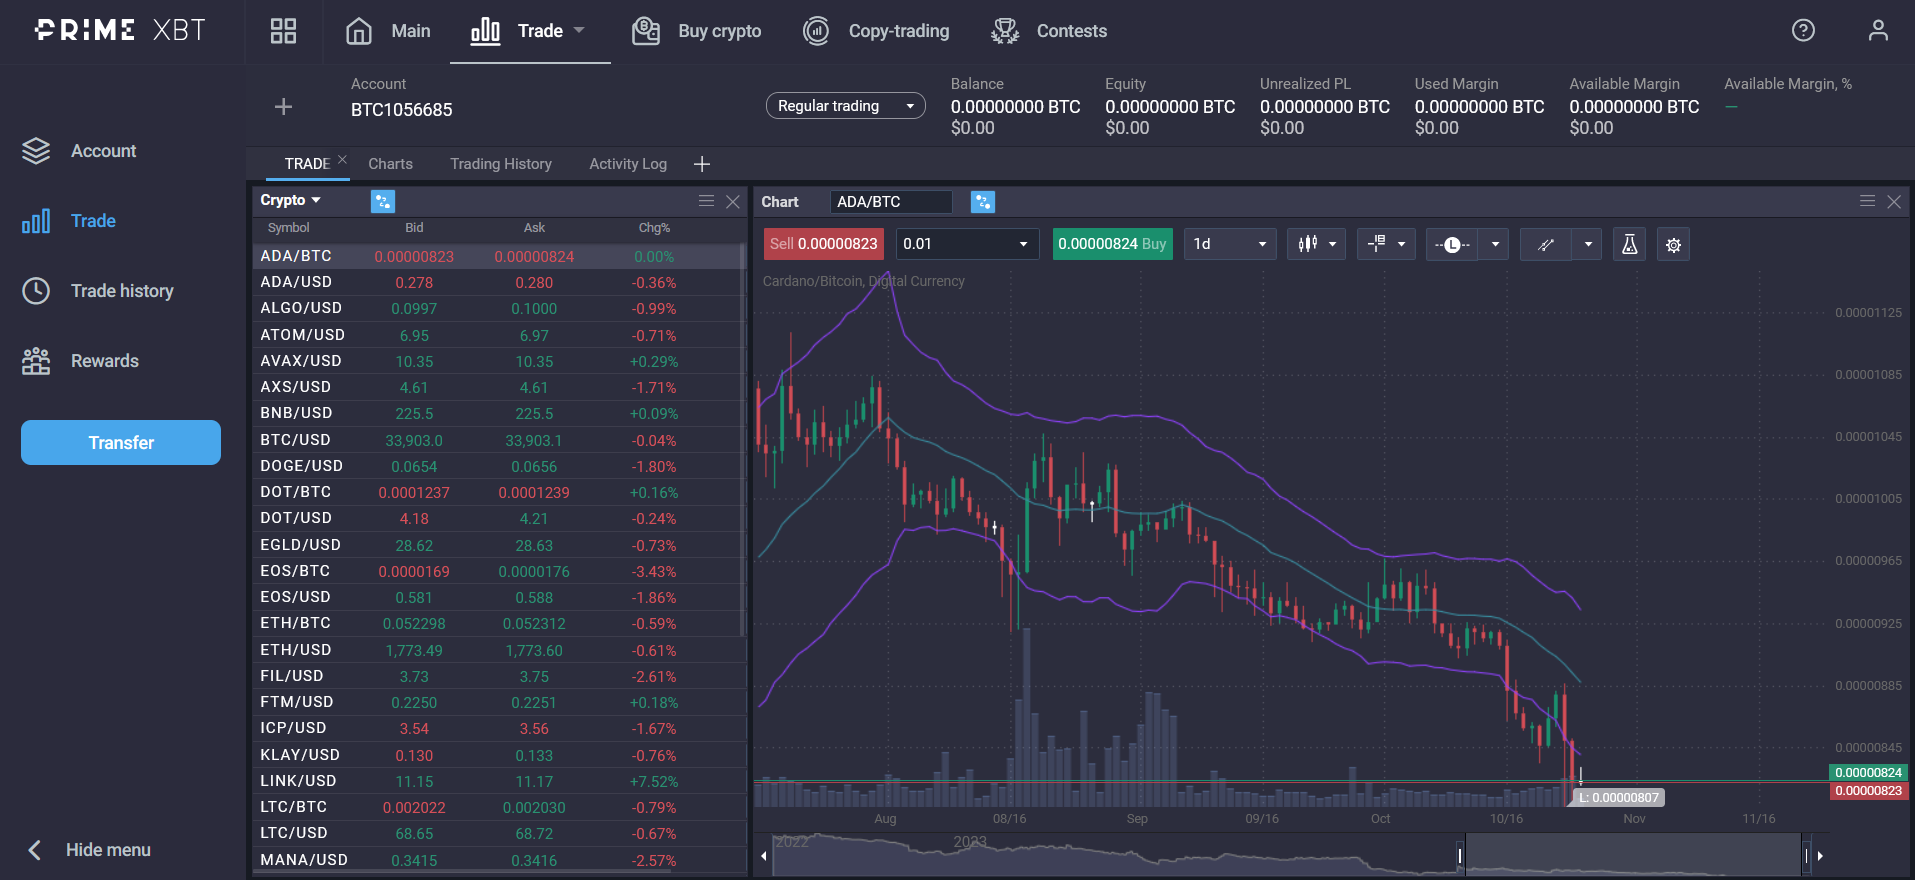
Many traders use Keltner Channels for the trend pullback strategy.
When using the Keltner Channel strategy, many buy pullbacks during a positive price trend, or short rallies during downwards movements.
The term pullback comes from the pattern in which the a price breaks beyond the channel’s upper and lower lines, and then pulls back to the middle line.
The idea behind this trading strategy is based on market sentiment, i.e. once the price breaks, there are traders that will assume that the price action will continue the trend.
Most traders will open their trade around the rate at which the asset’s price broke out, and exit above the middle line.
A more conservative approach would enter the trade, set the stop loss at the lower channel line or the upper depending on the proceeding trend and their take profit at the middle line.
Breakout trading strategy
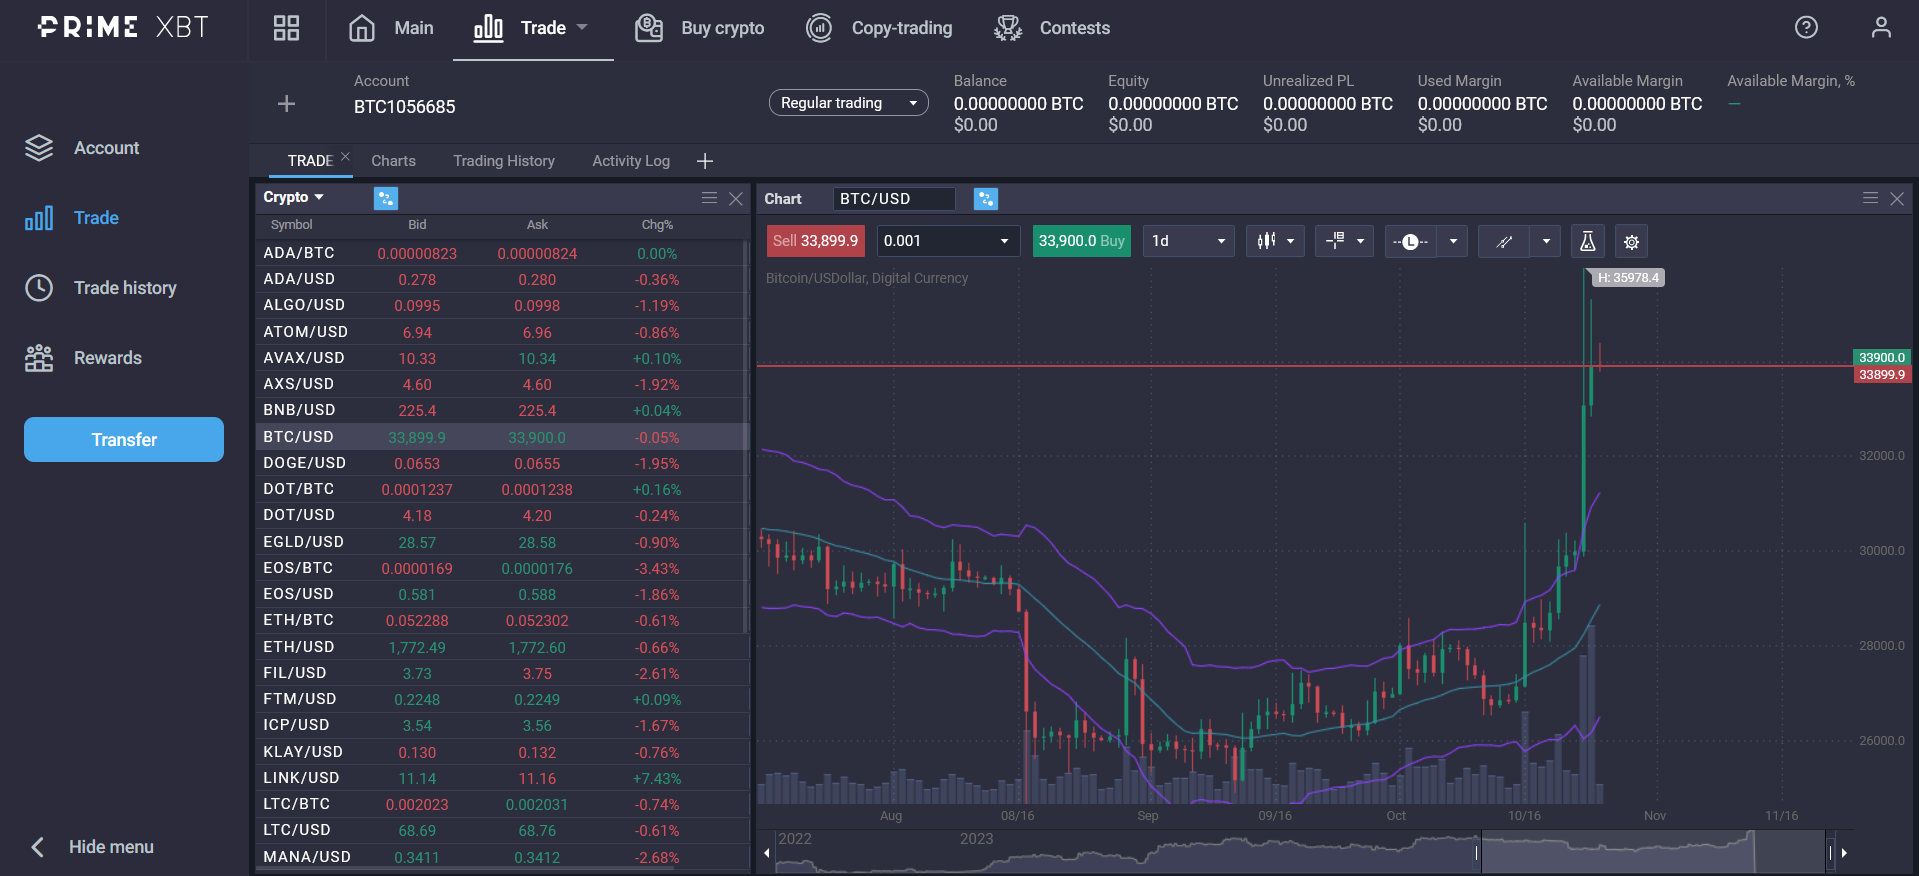
The breakout strategy, involves taking a bit more risk, for more significant rewards. The first requirement of the strategy is for the channel to be moving more or less horizontal.
Once he price breaks out of the channel, the trade is opened, hoping for continuation of the trend.
This is often used in conjunction with other momentum indicators such as MACD or ADX, to confirm that the breakout’s direction will continue.
Advantages and limitations
Keltner Channels are a very useful and powerful indicator, but it works best on the short and medium term.
Strategies that hold positions for a longer period of time, may not benefit from the use of Keltner Channels as much as people that trade over a shorter time period of time.
Traders that use Keltner Channels should also be aware of false signals which we will talk about in the Risks and Drawbacks section.
Due to their mechanics of using past data to contextualise market movements, all technical indicators, Keltner Channels included, do not take into consideration current market conditions, news or present market conditions.
Benefits of using Keltner Channels
Ease of use is one of the biggest benefits of Keltner Channels. At a glance you can see the current trend, volatility, the oversold and overbought conditions of the asset and of course implied support and resistance.
You would have to multiple simple indicators to see the same amount of information, making analysing your charts complex and challenging.
Risks and drawbacks
No matter how useful or powerful your indicator, there are risks and caveats.
A risk unique to using any type of indicator is the possibility of a false signal.
The best way to avoid falling into this trap, is to gather as much information as possible.
This includes using other indicators, that bridge the gap left by Keltner Channels.
The biggest gap being momentum, so indicators such as MACD or RSI are a great solution.
Keltner Channels vs Bollinger Bands
Although they do seem visually similar, with the middle line and two outer lines creating the channel, the main difference between Keltner Channels and Bollinger Bands is the way the two lines that frame the middle are calculated.
Bollinger Bands use a Simple Moving Average two standard deviations away from the middle line. Keltner Channels, as we saw above, uses two times the average true range and either adds it or subtracts it from a EMA.
Because of the EMA the Keltner Channels uses, and the ATR, this indicator follows the asset’s price closer which can be a benefit depending on your strategy.
Conclusion
Keltner Channels is a powerful indicator that can give you a lot of data that is easy to recognise quickly. You can see volatility, overbought or oversold status and the current trend.
But at the same time it can yield false signals (like most indicators) so they are best used in conjunction with other indicators, to help you confirm potential signals.
What do Keltner Channels tell you?
They can show the current trend, if the asset is overbought or oversold and market volatility.
Which is better Keltner or Bollinger?
Both have their uses, depending on the timeframe you are trading or investing at. Keltner Channels generally follow the asset's price action closer because it uses EMAs and ATRs in its calculation.
Is Keltner Channel a leading or lagging indicator?
When compared to Bollinger Bands, it can be considered a leading indicator.
The content provided here is for informational purposes only. It is not intended as personal investment advice and does not constitute a solicitation or invitation to engage in any financial transactions, investments, or related activities. Past performance is not a reliable indicator of future results.
The financial products offered by the Company are complex and come with a high risk of losing money rapidly due to leverage. These products may not be suitable for all investors. Before engaging, you should consider whether you understand how these leveraged products work and whether you can afford the high risk of losing your money.
The Company does not accept clients from the Restricted Jurisdictions as indicated in our website/ T&C. Some services or products may not be available in your jurisdiction.
The applicable legal entity and its respective products and services depend on the client’s country of residence and the entity with which the client has established a contractual relationship during registration.

