If you have been trading for any time, you will come across the term “Fibonacci retracements.” This is a tool that a lot of traders use and is based upon mathematical levels found throughout nature. There is a considerable debate as to whether or not it has any inherent use other than a simple “self-fulfilling prophecy” aspect, as so many traders tend to be attracted to it.
What Are Fibonacci Retracement Levels?
Fibonacci retracement levels are lines on a chart that indicate where support and resistance could appear. Each of these levels is associated with a percentage. The percentage represents how much of a prior move has pulled back. Fibonacci retracement levels include 23.6%, 38.2%, 61.8%, and 78.6%, which is not technically a Fibonacci number, but many traders use it due to historical precedence.
The tool is somewhat helpful in giving you a bit of a roadmap going forward. It can be drawn between two significant swing high and swing low levels and automatically creates potential support or resistance levels between those two points.
Fibonacci Retracements vs. Fibonacci Extensions, the Difference
A Fibonacci retracement applies percentages to a pullback, while a Fibonacci extension applies percentages to a move in the same direction as the overall trend. Think of the following move in the Bitcoin market: Bitcoin goes from $12,000 to $18,000 and back down to $15,000. The move from $18,000 to $15,000 is a retracement. (This is a 50% retracement of the full move.) If the price rises again and goes to the $21,000 level, that is an extension.
What is the Fibonacci Sequence in Stocks?
The Fibonacci sequence used in stocks is one way people will try to figure out buying and selling behavior in markets. In stock markets or any other financial asset, traders will look for specific areas such as a 38.2% Fibonacci level or other ones such as 50% or 61.8%. In other words, once a market moves, the trader will look for a pullback from the initial shot higher or lower to pick up value and follow the overall trend.
Some of the most common ones include 38.2% retracement, 50% retracement, and 61.8% retracement, but there are others, such as 23.6% and 78.6%. That being said, the first three are the most commonly used ones. Most trading platforms include these levels in the Fibonacci retracement tool of their charting features.
How Do Fibonacci Retracements Work?
Fibonacci retracements are typically used for trade management. The levels are usually used for entry orders, stop-loss orders, or setting price targets. For example, you may see an asset moving higher, but then it pulls back. Perhaps it pulls back to the 61.8% Fibonacci level, which could be an area of potential support. This allows the trader to enter an uptrend with perceived value.
The trader may put their stop loss underneath the 61.8% Fibonacci level after a bounce, using it as an area that could determine the overall trend. Fibonacci levels are also probable and used in other forms of technical analysis such as Elliott Wave theory and Gartley patterns. Reversals also tend to find Fibonacci levels in these types of technical analysis.
Unlike moving averages, Fibonacci retracement levels are static. The static nature of the retracement level allows traders to use them for quick and easy trade management levels. While they can be somewhat predictive, they are typically used as a secondary indicator of a potential reversal or breakdown.
The Formula for Fibonacci Retracement Levels
Fibonacci levels are easily plotted on a chart. Therefore, you do not need to worry about the exact formula. The user chooses two points, typically a swing high and a swing low, allowing the indicator to draw lines at the essential percentages.
If the price of an asset rises from $20 to $30, and the trader uses these as a swing high and swing low, the indicator draws several lines. At that point, the 38.2% level will be at $26.18 ($30 – ($10 x 0.328) = $3.82). The 50% level will be at $25.00 ($30 – ($10 x 0.5) = 25.00).
How to Calculate Fibonacci Retracement Levels
Luckily, most modern trading platforms make the need to calculate Fibonacci levels obsolete. A tool draws the retracement levels automatically, so it comes down to the trader to determine where the swing high and the swing low of a particular move are. Once that’s done, the indicator itself does all of the work.
That being said, understanding the origin of Fibonacci numbers is worth looking at. They are based on something called the Golden Ratio. You start a sequence of numbers at zero and one. Keep adding the last two numbers to get a string of integers like the following:
0, 1, 1, 2, 3, 5, 8, 13, 21, 34, 55, 89, 144, and so on, with the string of integers going on indefinitely.
Fibonacci levels are derived from this number string. Once the number sequence gets going, dividing one number by the following number yields 0.618, or 61.8%. Divide a number by the second number, and the result is 0.382, or 38.2%. All ratios, except for the 50% Fibonacci retracement level, are based on calculations involving this number string.
It is worth noting that the 50% Fibonacci level is not an actual Fibonacci level. It does not occur mathematically; instead, it is simply a throwback to the way traders used to buy dips in a market. As a general rule, once a trader recognizes that a market has rallied and then pulled back, it has been common on Wall Street to start trying to build a position when the market gave back half of its gains.
How to Draw Fibonacci Retracement
The first thing you need to do is find a swing high and a swing low. You drag the tool from the low to the high and an uptrend or the high to the low in a downtrend. At this point, the tool will show several levels, all of which are Fibonacci retracement levels.
The next step is to pay attention to price action and whether or not one of these levels will kick off a trade. At that point, you begin to think about how to use Fibonacci retracements in trading.

How to Use Fibonacci Retracements in Trading
Fibonacci lines are created when you drag the tool between the high and low points of a big move. The tool automatically draws the key Fibonacci ratios, showing horizontal lines on the trading chart at the 23.6%, 38.2%, and 61.8% retracement levels. Traders also use the 50% retracement level, although it is not technically a Fibonacci sequence number.
By dragging from a swing low to a swing high, these numbers and lines appear on the chart showing where the market may turn around on a pullback and resume the overall trend. However, if you are in a downtrend, you simply reverse the process by dragging from the swing high to the swing low, looking for the market to stall on any bounce near a Fibonacci level.
Fibonacci Support and Resistance
Most traders will use Fibonacci levels to identify potential support and resistance levels. When a market is trending up or down, and usually pulls back slightly before continuing the trend. It will often retrace to a critical Fibonacci retracement level such as 61.8%, 38.2%, or the 50% level.
Sometimes, traders will use these as signals to enter new positions in the direction of the original trend. In an uptrend, you may wish to buy on a retracement down to one of these key support levels. In a downtrend, you may look to go short a market that bounces up to its key resistance level. That said, quite frankly, people will generally look for price action to determine whether or not the level holds instead of simply following the level blindly.
What Are Some Examples of The Fibonacci Pattern?
Fibonacci traders pay close attention to an asset’s swing high and swing low, drawing the tool across that move. The two examples below show you exactly how it plays out.
GBP/JPY example
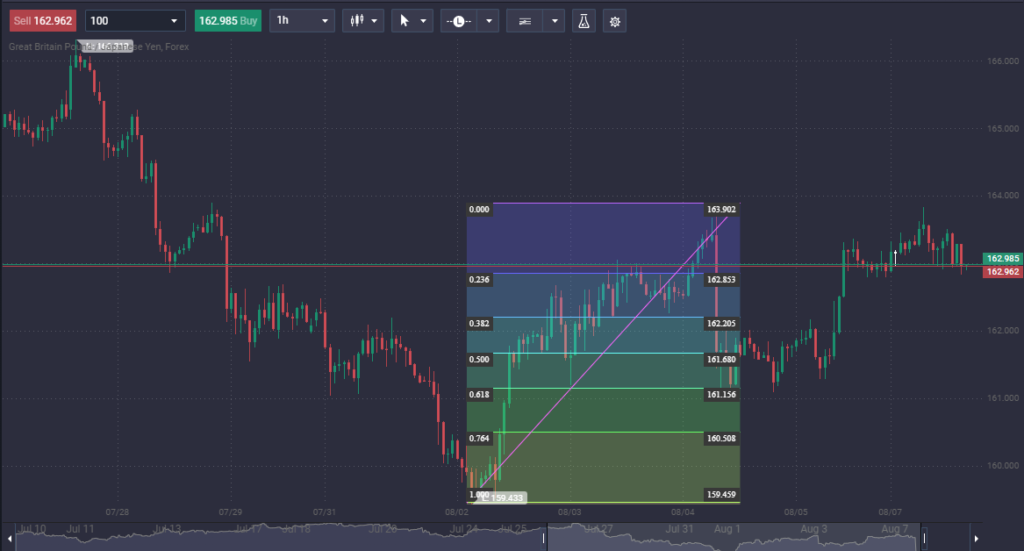
Notice how the market in the British pound against the Japanese yen bottomed near the ¥159.50 level. The market then rallied to the ¥163.90 level before pulling back. Notice how the market had found some support at the 61.8% Fibonacci level and then turned around the rally. This is a perfect example of the market turning around at the “golden mean.”

Oil example
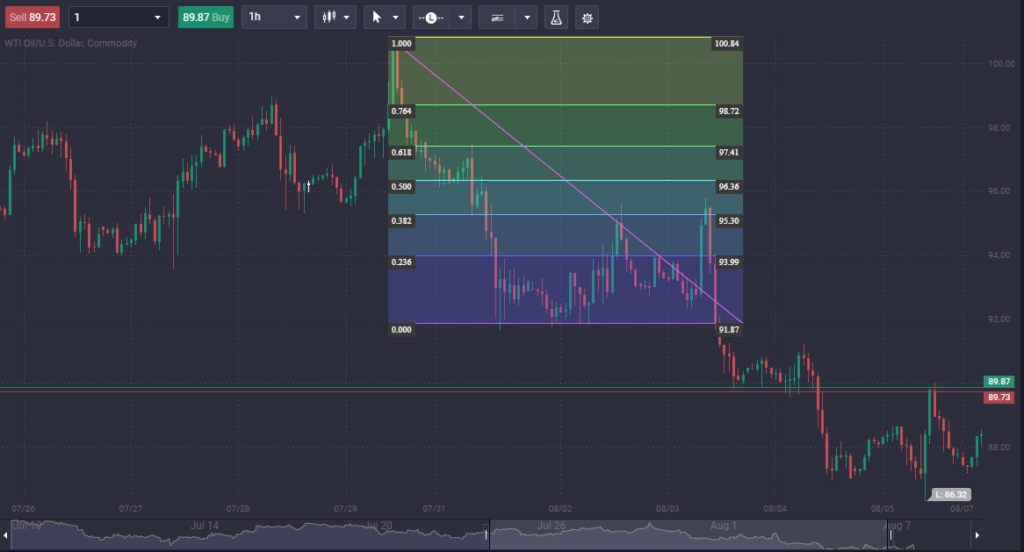
In the crude oil market, you can see that we had fallen quite significantly from the $100.84 level to reach down to the $91.87 area. We then bounced from there, and have seen the 0.382% level, or $95.30, offer resistance a couple of times since then.

What Are the Best Fibonacci Trading Strategies
Fibonacci retracement lines are, by their nature, often used as part of a more comprehensive trend trading strategy. If the retracement is taking place within a larger trend, you can use the Fibonacci levels to place a trade in the same direction as the overall trend.
Fibonacci levels are helpful if the trader wants to buy a stock or other asset but has already missed out on the initial uptrend or downtrend. Instead of “chasing the trade,” you are better served by trying to find value. All trends pull back eventually, and it can show a potential entry by plotting Fibonacci ratios such as the 38.2%, 50%, and 61.8% levels.
- Combining Fibonacci retracement levels with the MACD indicator is quite popular. The strategy looks for the MACD indicator to have a crossover, incongruence with the market touching a critical Fibonacci level.
- Combining Fibonacci levels with the Stochastic Indicator is also very popular. This indicator is used to identify overbought and oversold levels. The strategy looks for key signals from the Stochastic Indicator while the market touches a Fibonacci level.
- Fibonacci levels can also be used across multiple time frames but like much of technical analysis, tends to perform better on higher time frames. This is because more traders and more volume are needed to create a weekly trend, as an example.
The platform at PrimeXBT is designed to use all of these popular trading strategies and more. You can apply Fibonacci strategies to crypto, commodities, indices, and forex in one intuitive platform.
What Are the Advantages of Fibonacci Retracements?
Several reasons make using Fibonacci retracements advantageous in trading financial markets. Some of the biggest ones include:
- Widely followed: While there’s no way to know if there’s any “magic” to the Fibonacci retracement indicator, the fact that so many people follow it gives it a certain amount of credence to begin with. This is much better than using obscure indicators.
- Automatically means value: In theory, if the retracement works to hold support or resistance, you are getting value on your trade. You are not chasing the trade; you are finding an asset after it sells off to offer value or an asset that rallies a bit in the face of massive selling pressure. This could lead to more significant profits.
- Can be used with other indicators: One of the great things about Fibonacci retracements is that they are easily used with other indicators or systematic market approaches.
What Are the Disadvantages of Fibonacci Retracements?
Fibonacci retracements have several disadvantages as well. After all, the market can be a very noisy and messy place, so there are a few things you need to keep in mind if you are going to try to use Fibonacci:
- Fibonacci levels are subjective: The biggest problem you will have using Fibonacci is that there’s no real way to know whether or not the market is using the same swing high and swing low. Remember, market participants are focusing on multiple time frames.
- Hard to tell which level holds: The first question you must ask yourself is which level will hold as support or resistance? This is why Fibonacci cannot be used alone because you need another reason for the market to turn around. At this point, it becomes a secondary or even tertiary indicator.
Conclusion
Fibonacci retracements are used by quite a few traders in various markets. They are used by short-term traders, long-term traders, and investors alike. Like other forms of technical analysis, Fibonacci retracements will work across multiple time frames, but the longer-term charts tend to be more reliable.
Fibonacci is widely followed, but it’s not necessarily proven. It’s also a very subjective type of technical analysis, so you need to be aware that different people will look at it through a different prism. Because of this, Fibonacci is more likely than not to be successful if you use it with another type of analysis, perhaps price action. For example, if you see the market pullback to 38.2% and form a massive hammer, that might be a sign that we are ready to continue going forward. Other people may use something like Bollinger Bands or even moving averages.
The Fibonacci level tends to be an area that many people will pay close attention to. Still, it is something that many traders will use to confirm a potential setup, much like a secondary indicator. Because it is so widely followed, it can lead to a self-fulfilling prophecy in markets at times.
How do you use Fibonacci tools?
Fibonacci tools suggest where potential support and resistance can be found. Ultimately, the jury is still out whether or not it is a “self-fulfilling prophecy” or if there is something more to it. That being said, enough traders use it that it’s at least worth paying attention to. Some traders believe it is a tool to predict support or resistance.
How do you draw Fibonacci retracements?
Fibonacci retracements are drawn from either swing high to swing low in a downtrend, or swing low to swing high in an uptrend, thereby spreading out various levels worth paying attention to.
Which time frame is best for Fibonacci?
Markets are fractal, and so are Fibonacci levels. That being said, most technical analysis works better on higher time frames. This is because more traders are involved at higher levels.
What are the best Fibonacci levels?
The most important Fibonacci levels are the most widely followed. This includes the 61.8% level, the 50% level, and the 38.2% level.
Does Fibonacci work in day trading?
Fibonacci is a fractal pattern; therefore, it should at least work in theory in any timeframe.
What is a Fibonacci trading strategy?
A Fibonacci trading strategy involves using the Fibonacci extension, retracement, or time-based tools to recognize potential turning points in a market.
Where are Fibonacci retracements placed?
Fibonacci’s are placed at swing highs or swing lows to determine where dynamic support or resistance may appear.
How do you use Fibonacci in an uptrend?
Fibonacci retracement tools can be used by drawing from the swing low to the swing high. This fans out multiple levels that people will be paying attention to who is a Fibonacci-based trader.
The content provided here is for informational purposes only. It is not intended as personal investment advice and does not constitute a solicitation or invitation to engage in any financial transactions, investments, or related activities. Past performance is not a reliable indicator of future results.
The financial products offered by the Company are complex and come with a high risk of losing money rapidly due to leverage. These products may not be suitable for all investors. Before engaging, you should consider whether you understand how these leveraged products work and whether you can afford the high risk of losing your money.
The Company does not accept clients from the Restricted Jurisdictions as indicated in our website/ T&C. Some services or products may not be available in your jurisdiction.
The applicable legal entity and its respective products and services depend on the client’s country of residence and the entity with which the client has established a contractual relationship during registration.


