An essential component of trading on the Cryptocurrency markets is the employment of candlestick charts.
Technical analysts and traders rely on various tools to facilitate strategies and improve the outcome of their activities.
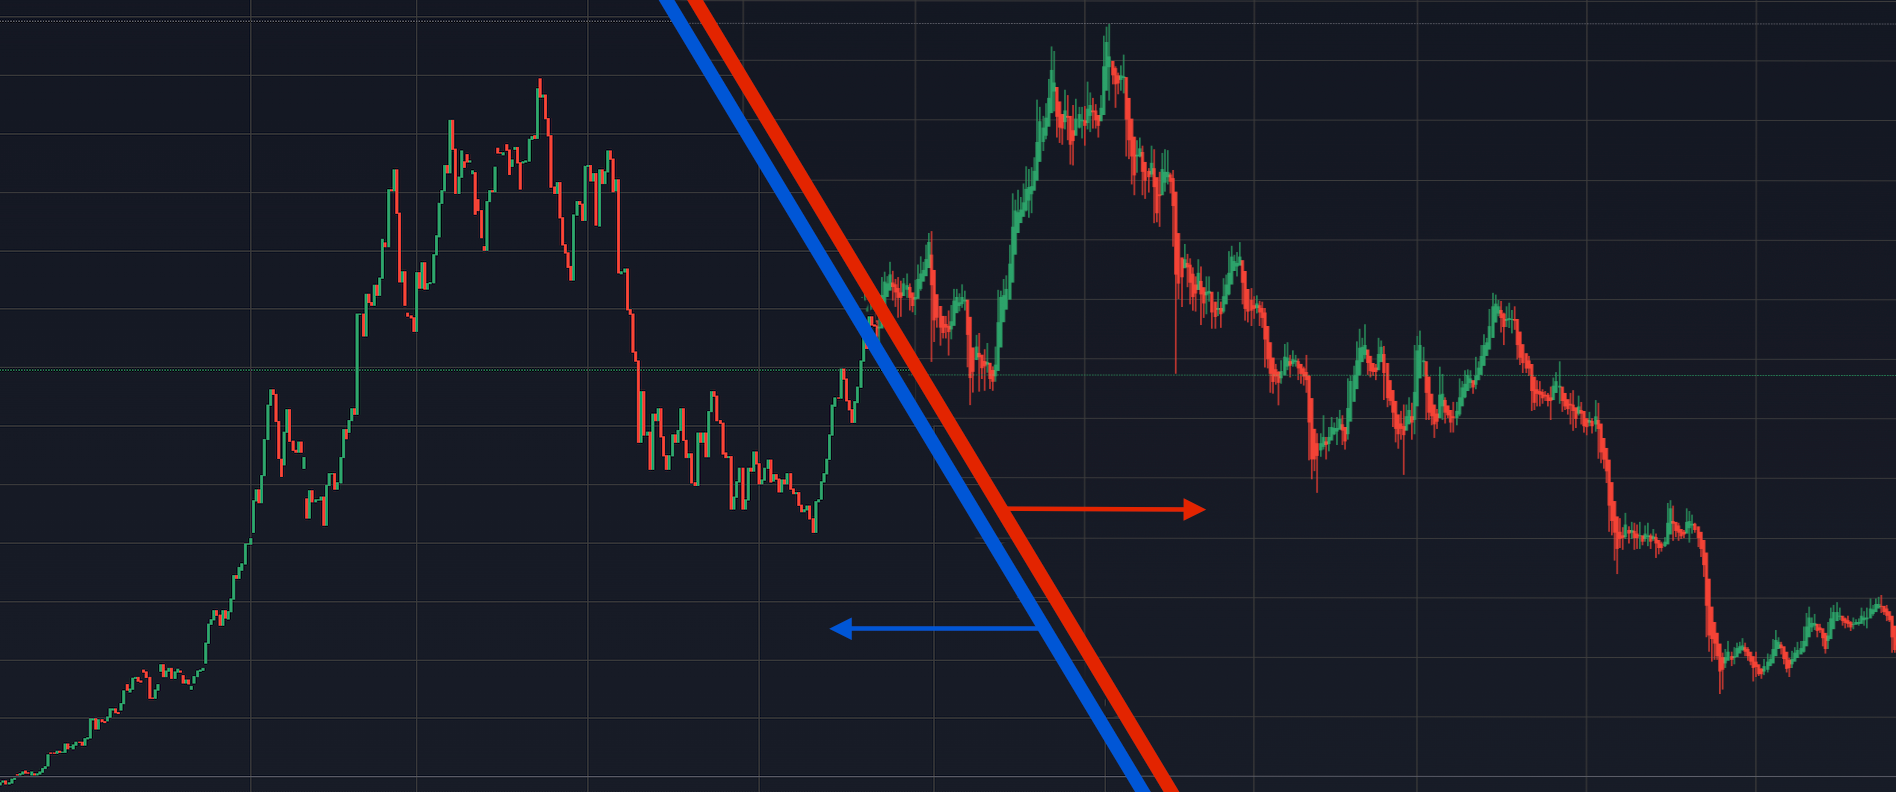
Amid a variety of such tools, Heikin Ashi and Traditional Japanese candlestick charts are some of the most popular.
Although both have numerous similarities, they have a core difference and cater to distinct trading styles.
Understanding a candlestick chart
It is not quite accurate to contrast Heiken Ashi vs Traditional candlestick charts as two opposite concepts for analysing the market and past price movements.
On the contrary, it is vital to understand that the Hekin Ashi candles are derived from the Traditional Japanese candlesticks as a modified formula with the purpose of targeting market trends.
The basics of Traditional Japanese candlesticks
Traditional Japanese candlesticks convey information about the open, high, low and close price data of an asset within a specific timeframe.
This formation sequence is generated based on a complex formula and is also known as the OHLC series.
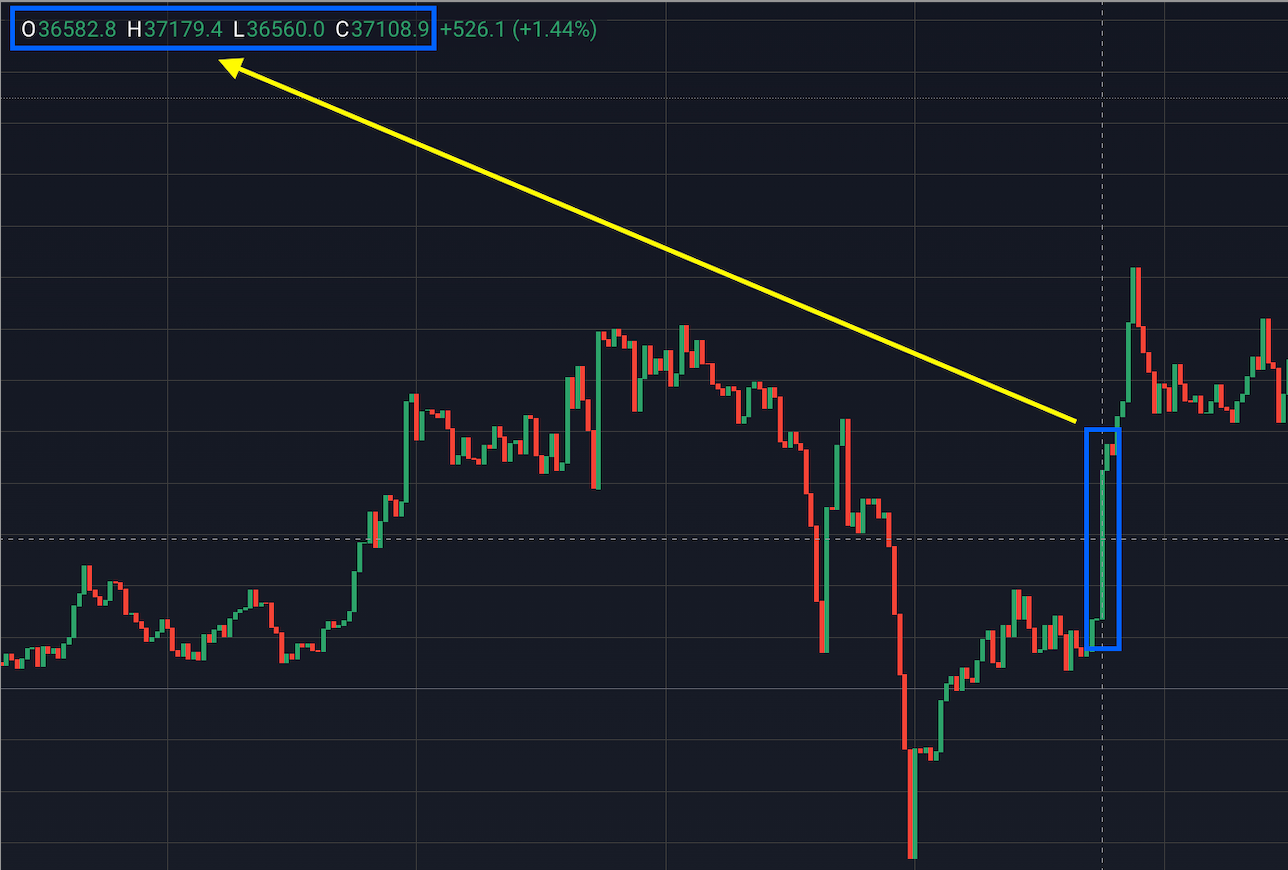
Traditional charts display a full spectrum of price action within a single trading session, which makes them versatile for utilising in multiple trading strategies and technical analysis. As well as for identifying candlestick patterns.
Introduction to Heikin Ashi candlesticks
On the other, a Heikin Ashi candlestick chart, whose name translates from Japanese as ‘average bar’, follows a different series – the COHL.
This sequence is based on a modified formula of two-period averages and focuses on the direction of a trend.
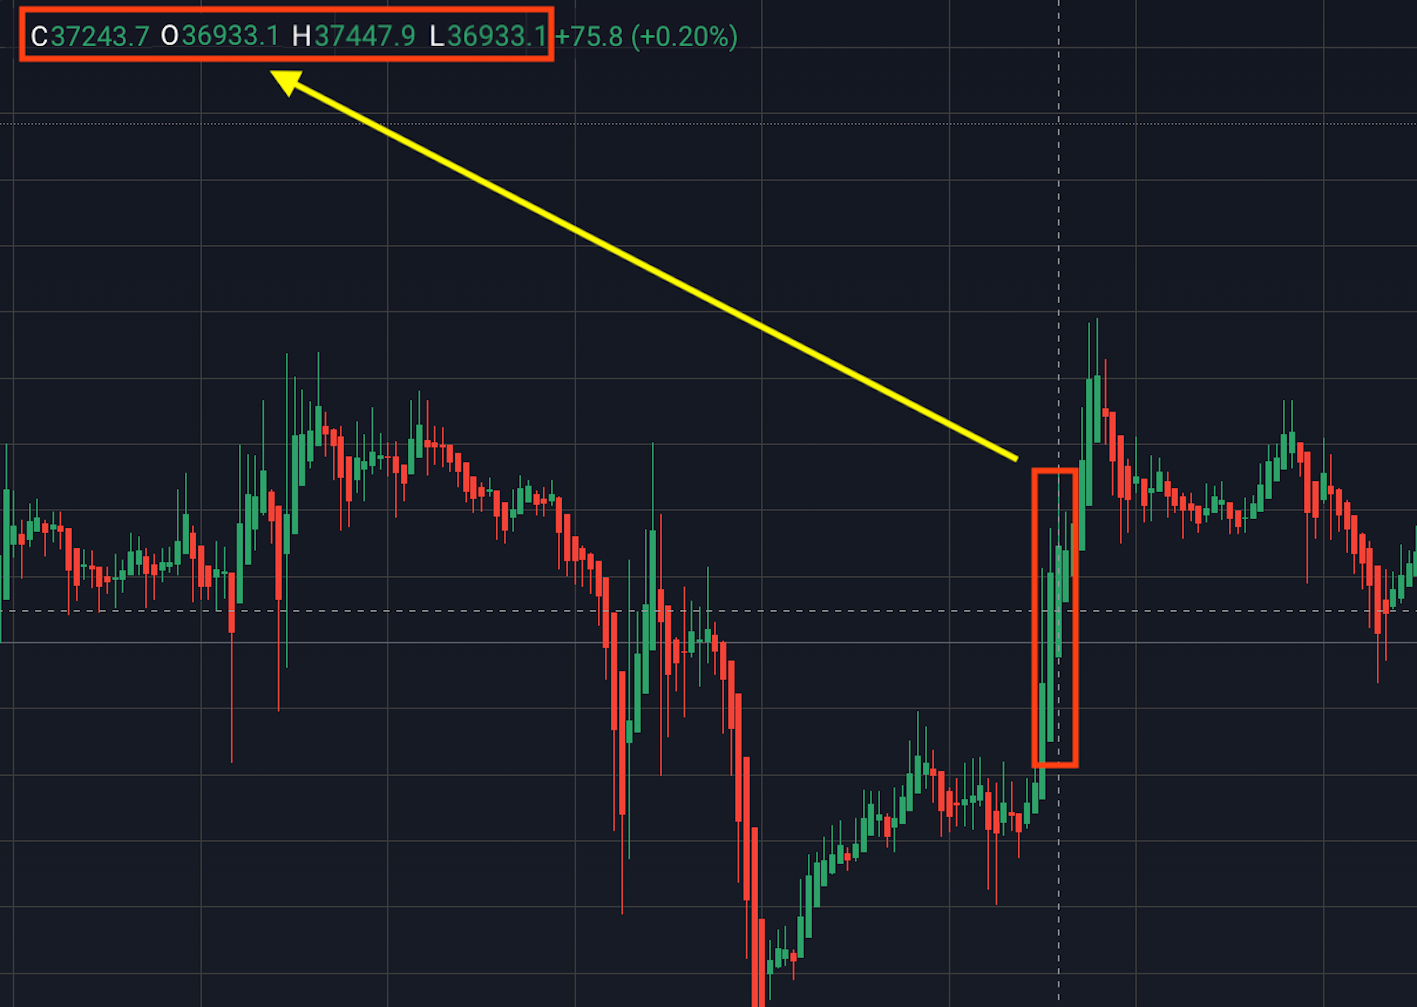
The Heikin Ashi technique doesn’t reflect the full range of price data, focusing mainly on the average price movements of an asset.
Cutting out the market noise gives it a unique advantage over the Traditional candlestick chart, particularly in identifying trends and their strength.
- In order to properly calculate Heikin Ashi formula, 4 main values need to be considered – opening price, closing price, lowest and highest values.
- Open. The opening price of a Heikin Ashi candle is always calculated from the middle of the previous candle(Previous bar open price + Previous bar close price) / 2.
- Close. The closing price of each candlestick is extracted from the average of all 4 values(Open + Close + High + Low) / 4.
- High. The high value does not require any complicated calculations as it can be determined by the highest value reached.i.e. High is equals to the maximum price attained.
- Low. Similar to the high value, the lowest value in the Heiken Ashi formula is equal to the actual value of the lowest price reached.i.e. Low is equal to the minimum price attained.
Comparing Heikin Ashi charts and Traditional candlesticks
At first, a comparison of a regular candlestick chart and a Heiken Ashi chart may seem obvious.
However, a deeper look into the technical peculiarities each one of them carries, provides a clearer understanding of how these concepts function and what purposes they serve.
Visual differences and interpretation
Heikin Ashi charts represent a smooth flowing graph of price action, where candles tend to be longer and less distorted.
This visual appearance is supplied by the average pricing model when calculations are centred on the previous candlestick.
Heikin Ashi candles provide a distinct overview of past and emerging trends. Unlike with the Traditional Japanese candles, when a strong uptrend is visible, green candles are consistently reflected on the chart.
And similarly with a strong downtrend, where red candles will be displayed.
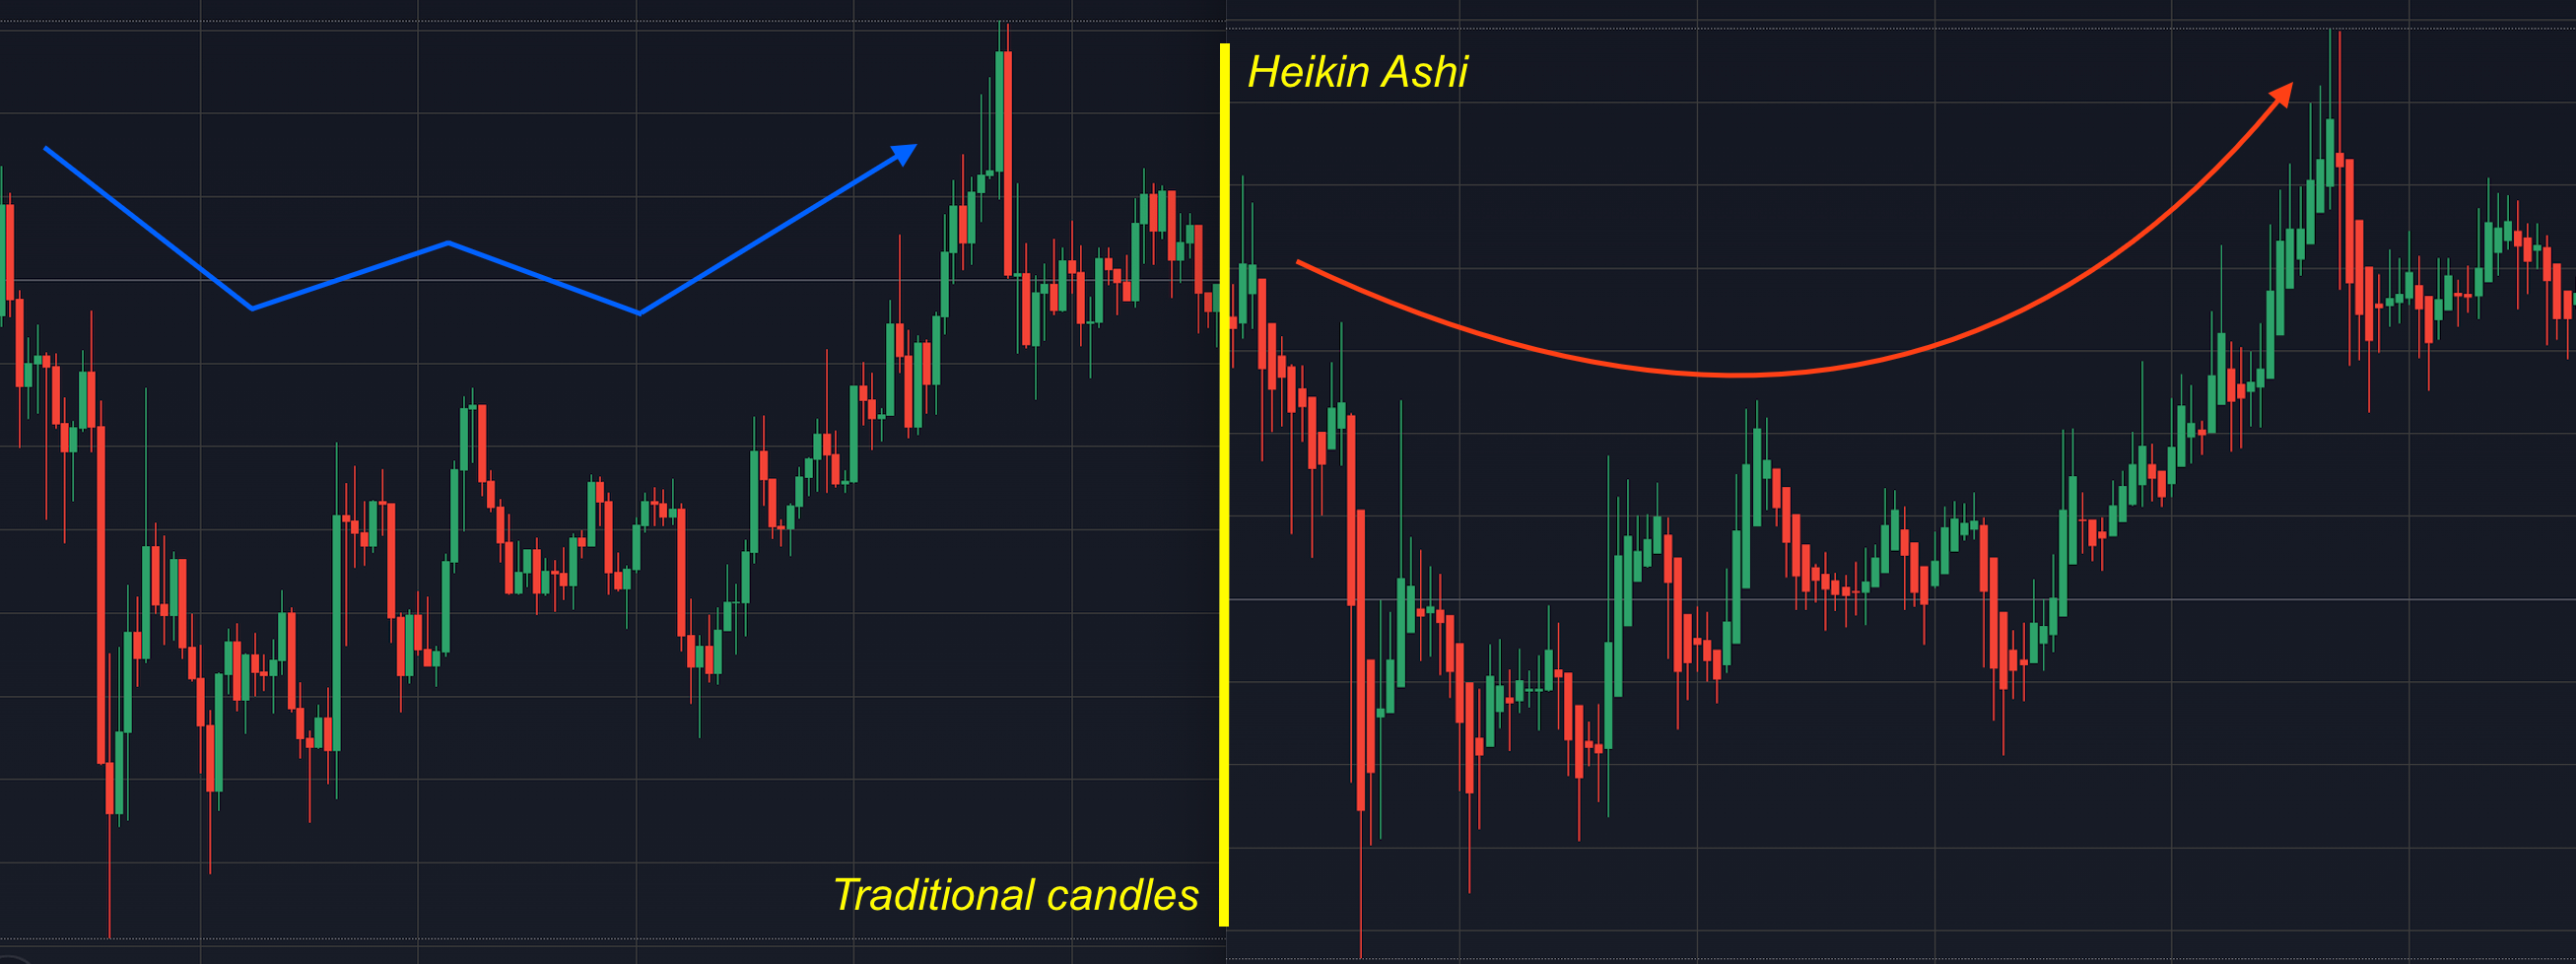
A trading session on normal candlestick charts, on the other hand (left in the image above), looks choppier.
Compounded data on the chart, that consists of all the price swings of the asset, makes the candles more intermittent.
However, the amount of accurate data reflected by normal candlesticks allows traders to make more precise trading decisions.
A bearish trend, for example, interrupted by green candlesticks could serve as a signal that market sentiment is not consistent, leading to a potential trend reversal.
Strengths and weaknesses in trend analysis
- Heikin Ashi charts. Average price focused Heiken Ashi candles are a perfect tool to identify trends. The reason for this is the simple and comprehensive formation of candles.One after another, each emerging candle starts at the middle spot of the previous. This allows both seasoned and novice traders to easily adapt to this tool.The downside of this concept are the inherent limitations associated with this trading technique.Setting up and executing this trading strategy requires much more time, which limits high-frequency traders and low-time frame scalpers from using it.
- Traditional Japanese charts. Traditional candlesticks are well suited to analysing trends as they provide the full scale of vital price information.They equip the trader with the current price of an asset which Heikin Ashi charts don’t.The weak spot of traditional chart trading techniques is the fractional access to data on smaller time frames.Theory suggests that price action data is accumulated per candlestick, which makes greater time frames a better field for searching for stronger signals that potentially allow for more profitable trades.
Practical applications in trading
Besides both chart types having pros and cons, they also have essential purposes which many traders resort to in technical analysis.
Using the normal candlestick chart for detailed market analysis
Traditional candlesticks are quite effective when used mindfully and knowingly, to analyse the market for various indicators.
Here are just a few well-known:
- Doji. Doji candlestick patterns are known to often provide signals of a potential market reversal.Long-legged, Dragonfly and Gravestone candlestick types are commonly used to predict potential price movements.

Hammer. Hammer candlestick patterns are also a reversal type indicator, yet they require patience and caution, as prior confirmation is necessary to proceed planning any type of decision to enter a trade.
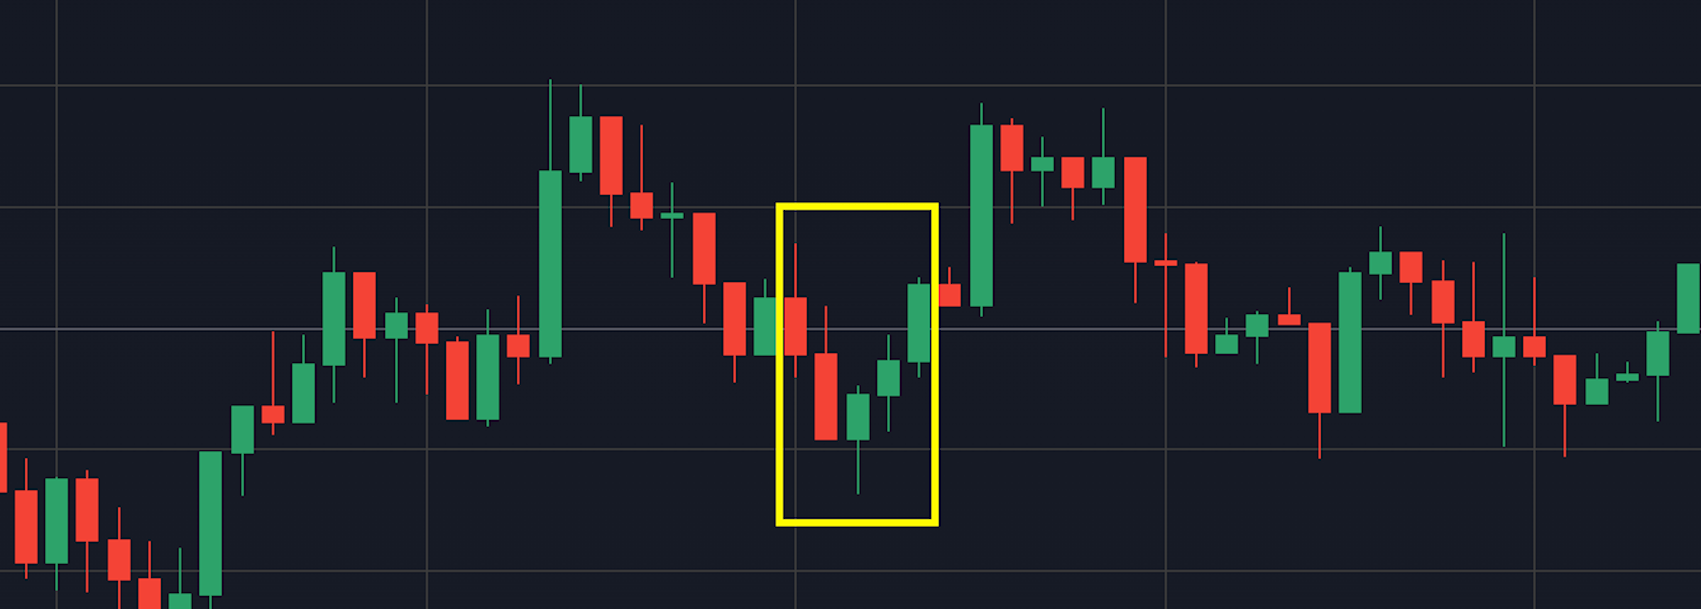
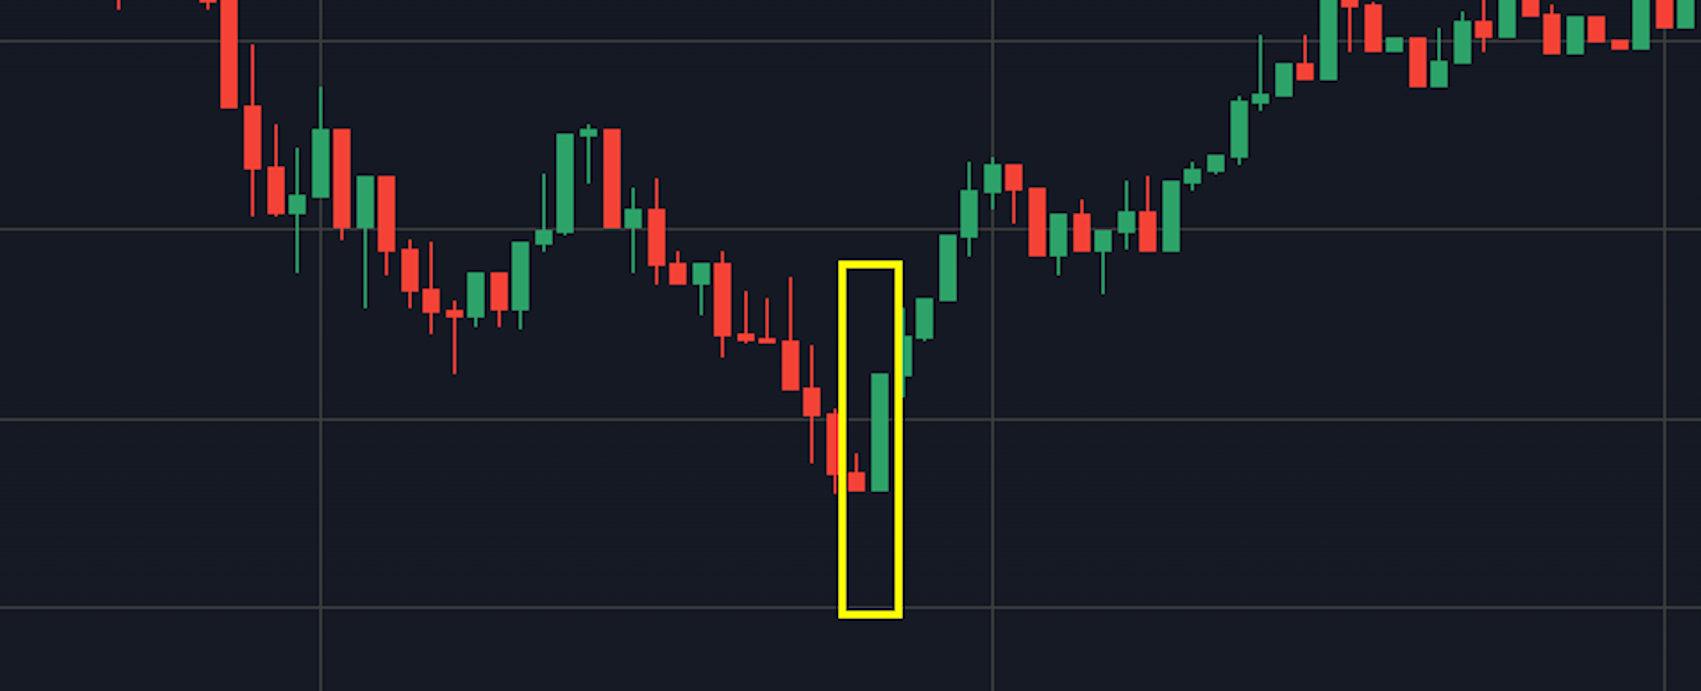
- Engulfing. Engulfing candlestick patterns can be both bullish or bearish.
They are slightly more complicated than Doji or Hammer to understand, yet are able to provide great rewards to those who can master them.
Leveraging the Heikin Ashi chart for smoother trend identification
Heikin Ashi candles imply a steady flow of averaged asset prices, which significantly simplifies trend detection and analysis, although they require much more patience than with a traditional chart.
The most important feature of these candles is the absence of market noise. This allows you to identify trends in an isolated manner, without the distractions of other indicators and market signals.
Which is better for trend identification?
Branding a specific candle type good or bad for trend identification is a fundamentally incorrect approach. Every trading technique is subjective and requires a situational approach.
Situational preferences
A choice between either of the two candlestick types should depend on many factors among which risk appetite, trading style preferences and general predisposition should be considered.
Many traders prefer to stick to only one style/technique, while others willingly jump between the two searching for the best option in specific market situations.
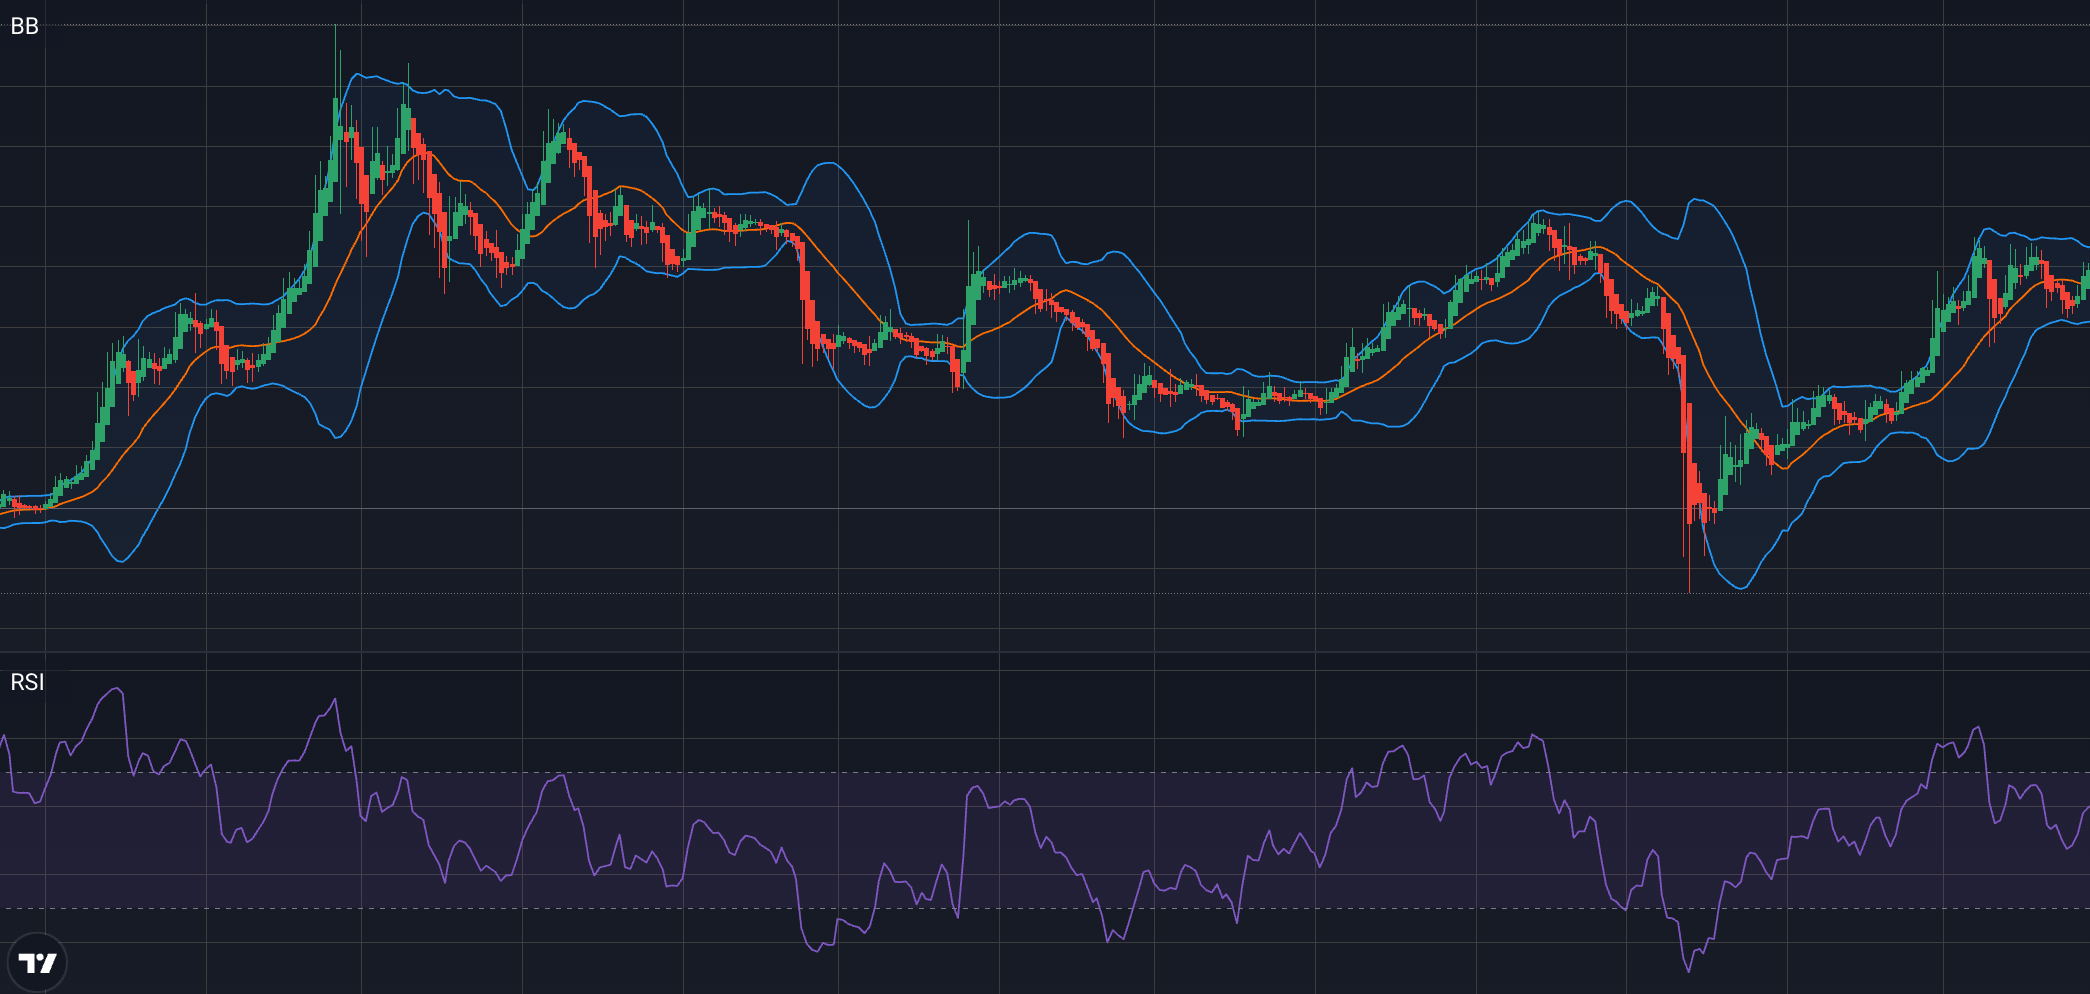
It is worth mentioning that Heikin Ashi pairs well with additional chart indicators like Bollinger Bands or the Relative Strength Index, if at the end of the day Heikin Ashi is your choice.
Combining both for comprehensive analysis
Fore those who are in constant search of a more holistic trading approach and choosing is not an obvious option, a combination of the two is a good solution.
Dotted access to averaged prices while monitoring the global market situation and current prices could potentially be a much more lucrative approach.
Conclusion
The Heikin Ashi trading technique is a beginner-friendly tactic and a great match for traders with advanced skills and knowledge of the market.
Whatever the cause, whether for a global overview of market sentiment, or detailed analysis of past and emerging price trends, Ashi candlesticks cater to multiple purposes.
It is crucial to keep in mind that absolute measurement could lead to a strategy failure and not every market scenario is applicable.
Thorough analysis and the utilisation of Heikin Ashi in conjunction with other technical indicators could potentially provide better results and improve overall strategy assessment.
Why not to use Heikin-Ashi?
A choice to use Heikin Ashi or not is a subjective decision. Yet for those who are interested in a less conservative trading strategy, Heikin Ashi may be a less suitable option.
Do professional traders use Heikin-Ashi?
Both novice and expert traders use Heikin Ashi to trade and set out strategies to improve their results.
What are the disadvantages of Heiken Ashi?
The inaccuracy of provided prices that do not match the current price of a specific asset, along with imposing a conservative strategy are the main disadvantages.
Is Heikin-Ashi better than candlestick?
Heikin Ashi is a modified formula of the Traditional candlestick chart and implies a trend analysis trading approach rather than exclusive candlestick pattern trading.
The content provided here is for informational purposes only. It is not intended as personal investment advice and does not constitute a solicitation or invitation to engage in any financial transactions, investments, or related activities. Past performance is not a reliable indicator of future results.
The financial products offered by the Company are complex and come with a high risk of losing money rapidly due to leverage. These products may not be suitable for all investors. Before engaging, you should consider whether you understand how these leveraged products work and whether you can afford the high risk of losing your money.
The Company does not accept clients from the Restricted Jurisdictions as indicated in our website/ T&C. Some services or products may not be available in your jurisdiction.
The applicable legal entity and its respective products and services depend on the client’s country of residence and the entity with which the client has established a contractual relationship during registration.


